fbpx Who Designs and Directs in LORT Theatres by Pronoun, 2012-2020 | HowlRound Theatre Commons

Who Designs and Directs in LORT Theatres by Pronoun, 2012-2020

Welcome to the final—for the foreseeable future—year of my study, which looks at who designs and directs in League of Resident Theatres (LORT) theatres by pronoun. You can find all the past studies here. This study encompasses data over eight seasons: from the 2012–2013 season up through the 2019–2020 season. The 2019-2020 and 2020 seasons have fewer productions than previous seasons due to the March 2020 COVID-19 pandemic shutdown in the United States. Some theatres had not begun or completed their designer hiring for their 2019-2020 and 2020 seasons. You can read the full study, as well as details on my process and notes on the data, in this PDF, or buy it in print if you prefer to engage with it that way.

Before you dive in, you should know (if you don’t already) that I’m not a data scientist, a data analyst, a graphic designer, a data visualist, a professional writer, an academic, a scholar, or someone who majored in statistics in undergrad. I never pretended to be.

I’m a mom, a reader, a friend, a researcher, a lighting designer, a wife, an activist, a union leader, a bisexual Asian American woman of color, an anti-oppression facilitator, and someone who does not fit in boxes particularly well. I’m someone who asks questions, has more curiosity than is probably good for me, loves stories, and has overdeveloped senses of empathy and responsibility. I’m trained in lighting design for theatre, and I never want anyone to go through all the painful things I’ve had to endure to be, and continue to be, a lighting designer for theatre.

And I write this study.

I wrote to a bunch of friendly production managers and asked how designers got hired at their theatres. The massive variety in responses was staggering, everything from, “The directors tell us who to hire,” to “We have a list and occasionally hire one or two designers who aren’t on the list if no one on the list is available,” to “I just get told who to send contracts to, but I don’t know how or why.”

I’ve told this origin story in interviews and on panels, but realized I had never actually written it into the study itself.

It was summer 2014, and my daughter, Lucy, had just turned one year old in May. I was looking ahead at the 2014-2015 season and had no theatre work. I had had no inquiries of availability or work offers as an assistant, associate, or lead lighting designer. It felt like everyone figured out I had a kid and stopped calling. Later, I had a designer tell me they had assumed I couldn’t afford to work as an assistant lighting designer because I had a child to take care of.

I was desperate to stay connected to the theatre field, having been a theatre kid since I was the stage manager for my seventh grade operetta. I had graduated from undergrad in 2003 and been interning, working, or going to grad school in theatre since. My second internship was in electrics at Trinity Rep, a LORT theatre. That’s where I started wondering who designs and how to become a designer in LORT theatres. I began looking at the websites of LORT theatres which, at the time, were not as robust and thorough as they’ve come to be. I abandoned the question, hoping and thinking that someone smarter than me, more educated in math and research, better with words, would come along to answer this question eventually.

Back in 2014, my beloved husband left theatre and took a full-time job as it became clear my fading to non-existent freelance lighting design career wasn’t going to help with the bills. I stayed home and took care of Lucy. Lucy was a great napper then, three hours a day like clockwork. But there could be virtually no noise in the apartment. Even folding clothes an entire room away was too loud. But I learned I could very softly type from three rooms away, at my kitchen table.

So instead of sending resumes and cover letters and reaching out to people looking for designers or assistants, I began to puzzle over this question I had had for a decade: who designs in LORT theatres? At this point I had been to grad school, where the prevailing wisdom had been that we’d be out a couple of years or so, designing in teeny places and assisting, and then design our first LORT production. At that point, I had been out of grad school for five years, had designed in many, many teeny places, assisted and associated for several very successful lighting designers, joined USA829 (the union), and had just designed a show for the most money I had ever made at a quite well-known and large theatre. But I still didn’t really know how people got to design in LORT theatres.

I wrote to a bunch of friendly production managers and asked how designers got hired at their theatres. The massive variety in responses was staggering, everything from, “The directors tell us who to hire,” to “We have a list and occasionally hire one or two designers who aren’t on the list if no one on the list is available,” to “I just get told who to send contracts to, but I don’t know how or why.” I followed-up, asking if on the theatre websites, the show pages were reliable sources of information on who designs each show. I got enough responses that basically said generally yes, but if changes were made after the show page went up, sometimes those changes didn’t make it. That’s what inspired me to ask theatres for confirmation.

I really thought I would find all this information, get it confirmed, and maybe share it with some friends on Facebook. And by then, my career in lighting design would come back to close to where it had been, and I wouldn’t have the time to continue trying to answer the question of who designs in LORT.

I knew I could organize the data in Filemaker Pro, a database program I learned while tracking moving lights on Spiderman: Turn off the Dark. I knew if I could make light plots in Vectorworks, a computer-aided drafting (CAD) program, I could probably figure out how to make pie charts and bar graphs. I knew I had pretty decent division and algebra skills and a calculator to figure out percentages.

And thus, the study was born.

But I hadn’t made an error. The percentage of positions held by lighting designers who used “she” pronouns from the 2009-2010 through the 2013-2014 seasons turned out to be only 13.7 percent.

It took me a little less than a year that first time around. Given that I had worked with many women lighting designers, and that I was one, I expected that set of percentages of positions held by men and women designers to be something like 75/25. When I calculated the percentage of positions held by women lighting designers from the 2009-2010 through the 2013-2014 seasons to be under 15.0 percent, I couldn’t believe it. I redid the calculations over and over, certain I had made a math error, flipped numbers, done something wrong because it couldn’t possibly be that low… right?

Since that number was so very low, I suddenly felt a responsibility and duty to the field to make these percentages available to anyone who wanted to know them. So I submitted a pitch to HowlRound while I was still writing theatres for more confirmations, still believing my numbers couldn’t possibly be correct.

But I hadn’t made an error. The percentage of positions held by lighting designers who used “she” pronouns from the 2009-2010 through the 2013-2014 seasons turned out to be only 13.7 percent. On 10 June 2015, the first infographic and article of the study went live on HowlRound, and I thought that was the end of that. My lighting design career had started to pick up again, and I was looking forward to working more.

Then the responses started pouring in. Most were complimentary; some were not. Most were affirming, a few vaguely threatening, and people started to ask when I would have the next season’s data done. And I panicked.

I always wanted to be seen and known as a lighting designer. And this call for more research felt like something different was being expected from me. Something that I knew could hurt my lighting design career. It’s really easy to get rid of a designer. You just don’t hire them again. As a designer, you never get an explanation—you just don’t get hired again. It might’ve been your work or your process, or it might’ve been that you asked for the heat to actually work in your apartment in February.

I got emails from fellow women designers telling me how when they had talked about feeling sidelined before, they had been told there were plenty of women designers working in theatre—they were just whining or complaining or their feelings were just not valid. When they read my study, they suddenly felt seen; they felt that their careers were important enough for someone to spend the time and labor researching, that their feelings had always been valid and true, and now they had the data to back them up.

That sense of responsibility, duty, and service to the field came flooding back, and with it came a deep gratitude to all the women designers who took the time to write to me about how the study impacted their lives. So I kept researching and finding more and deeper ways of trying to answer the question of who designs in LORT theatres. I love my designer community so much that I want all of us to feel seen in a field that often erases or diminishes our experiences. I want every designer, and especially those traditionally excluded from the mainstream narratives of theatres, to know they are seen and valid, their feelings are seen and valid, and their experiences are seen and valid.

It’s really easy to get rid of a designer. You just don’t hire them again.

Personal Reflections and How We Move Forward

I didn’t know what my study would become when I began the work. On this side, I just hope my study has done more good than harm in the world. Here we are for the seventh time, having gone from one chart to 116 charts, from five paragraphs in the first article to over 125,000 words of article, narratives, framings, and how-to equations. I think I accidentally wrote a book—a reference book, but still, a book.

By the time this is published, I’ll have been working on this study for roughly nine years of my life. My life is very different now than then. Lucy is ten years old and in fifth grade. I have worked as a lighting designer, an assistant lighting designer, an associate lighting designer, an interviewer of designers and technicians of color for Stage Directions magazine, the New York City Center Encores music director fellowship coordinator, a reader for Playwrights Realm play development programs, and as an anti-oppression facilitator and consultant, among other work. I have done a solid amount of service to the field, serving dutifully on advisory boards, committees, and more. Writing it all out like that feels weird and quite self-indulgent, and the last four work positions and most of the service happened at least partially because I do the study.

This is scary to say. I’m ready to not do the labor of the study anymore. Is there more work for equity to be done? Yes, of course, the work is never done. But I am ready to do things like look out of train windows and enjoy the scenery passing by instead of endlessly crunching numbers for the study. The study is a labor of love, filled with sweat, tears, hope, and a belief in the power of data to spark change, a gift of service from me to a field that can’t love me (or anyone) back. I’m so tired and burnt out, and it’s time for me to prioritize some deep recharging of my own physical, emotional, and mental health. And it’s time for me to do something else. I don’t know what that is yet, and I’m excited to figure it out.

I hope this study makes you think about who gets to be a designer in theatre, who gets to be seen and validated as a designer in theatre, and who gets to be sustained and appreciated as a designer in theatre. I hope my study is seen as an example of research as care, as love for my community. I wish all my fellow designers—especially those of us from traditionally excluded communities—a future where theatres see, hear, validate, affirm, and value you in the complete wholeness of your beautiful humanity, and support you in all the ways you deserve. I love you.

When they read my study, they suddenly felt seen; they felt that their careers were important enough for someone to spend the time and labor researching, that their feelings had always been valid and true, and now they had the data to back them up.

My Process

Readers from last time around might remember I launched a survey to gather self-identified demographic information from LORT designers and directors with the hope of putting out more reports. After struggling for two years to get enough self-identified responses and reaching less than 20 percent in any one discipline, I shut down the survey.

My data collection method is simple: I collect the data primarily from the theatres’ own websites, Theatre Communications Group member profiles, and various newspaper and review websites, including broadwayworld.com and playbill.com. Then, I write the theatres directly and ask for confirmation and/or correction of the data. I exclude the following productions from my research: tours, events, galas, theatre for young audiences, and any production that was presented rather than produced.

Then I get all the data into a database program, Filemaker Pro, and some of it into various Excel documents for ease of calculations later. In prior years of the study, I stuck with what I found as someone’s pronouns the first time they appeared in the study. This time around, an assistant and I looked for every single person’s pronouns to see if anyone’s had been updated since first appearing in the study. Finding a small number of folx had, I then did deeper research to find out when the person’s pronouns had been updated and updated the show data accordingly.

After getting confirmations back from most theatres, I begin extensive error checking to prevent having to redo as much as possible later. I dig into all the calculations and counting. Then I (and this time around, an assistant) updated old charts, made the variations on old charts, and created the new charts in Vectorworks. When I can’t stand to look at Vectorworks anymore, I start the narratives for each chart. I began writing the narratives in 2018 for the fourth year of the study to make the study more accessible and to get more information in. There’s only so much visual information I can pack into the charts, so the narratives have been a great place for me to include lots of the other data to provide a fuller picture of the information.

Then I send drafts into my HowlRound editor and begin work on the PDF. After lots of error checking, edits, and making sure I’ve given my very best effort to make sure everything is as close to correct as possible, the article and study are published. And in prior years, that would begin a break before starting on the next year’s study.

Notes on the Data

In cases where theatres run their seasons by calendar year rather than academic year (e.g., from January to December 2013 rather than September 2012 to August 2013), I merge that data with the most recent corresponding academic year (e.g., the 2013-only seasons are combined with the 2012–2013 seasons). Only lead designers—no assistants or associates—are counted. In cases where multiple designers work as co-designers, they each get partial credit (e.g., a designer who uses “he” pronouns and a designer who uses “she” pronouns are the co-scenic designers of a production, so they each receive 0.5 in the design count). People are counted as individual designers in each discipline—scenic, costumes, lighting, sound, projection/video—even if they designed in two or more disciplines on the same production.

There are many more non-LORT theatres than there are LORT theatres, and many designers and directors work both inside LORT member theatres and elsewhere. This study does not reflect the totality of an individual’s work over the eight seasons. Although there are some resident designer jobs, the vast majority of design positions do not go to resident designers, and I have not made a distinction between resident and freelance designers in this study. Also, in one case, the “head” of the theatre is an executive director rather than an artistic director, so that’s the information I used for the statistics.

Stage categories are determined by the LORT-AEA agreement (weekly box office receipts and Tony Award eligibility) and the LORT-SDC agreement (C category divided into two categories by number of seats). More information on minimum rates for designers based on LORT stage categories can be found here.

In total, 96.0 percent of the data from the 4,199 productions over the eight seasons was confirmed by the seventy-eight LORT member theatres. For the 2019–2020 and 2020 seasons, 86.0 percent of the 506 productions were confirmed. However, all the graphs are based on both confirmed and unconfirmed information. Given that some theatres also confirmed previously unconfirmed data from past seasons, some statistics may be different than the last time.

There are many more non-LORT theatres than there are LORT theatres, and many designers and directors work both inside LORT member theatres and elsewhere. This study does not reflect the totality of an individual’s work over the eight seasons.

Please note that some of the yearly percentages are based on very small numbers of positions, particularly in the projection/video design discipline and in certain stage categories. Percentages are rounded to one tenth of a percent, which resulted in some graphs not equaling exactly 100 percent. And, as always, correlation does not imply causation.

Once again, I’m trying a new way to visualize ranges of productions designed or directed. Hopefully, this pie chart inside a donut approach will be clearer than prior versions. I have added fifteen charts that are seasonal variations on existing charts.

There are fifty-one all-new charts this time. I would divide them into three categories. The first is the number of positions and designers/directors in each category and region, and then what those numbers look like over time. The second is a series of deep dives looking at four different ways of looking at the data: over the eight seasons studied, how many designers/directors worked on one or fewer LORT productions, how many designers/directors worked on a LORT production during all eight seasons, how many designers/directors were “new” to LORT (meaning they did not design in the first five seasons studied but did during the last three seasons studied), and looking more closely at the roughly 10.0 percent most prolific designers/directors. The reason it’s roughly and not precisely 10.0 percent most prolific is because I only divide positions, not people. In this case, when designers/directors held the same number of positions at the fewest positions in the roughly 10.0 most prolific, I included all directors/designers who held that number of positions. The third is a set of double correlations, examining how the different pronoun compositions of artistic director/director correlates with positions held by designers who use each pronoun set.

To read the full study click here

Selected Charts:
 

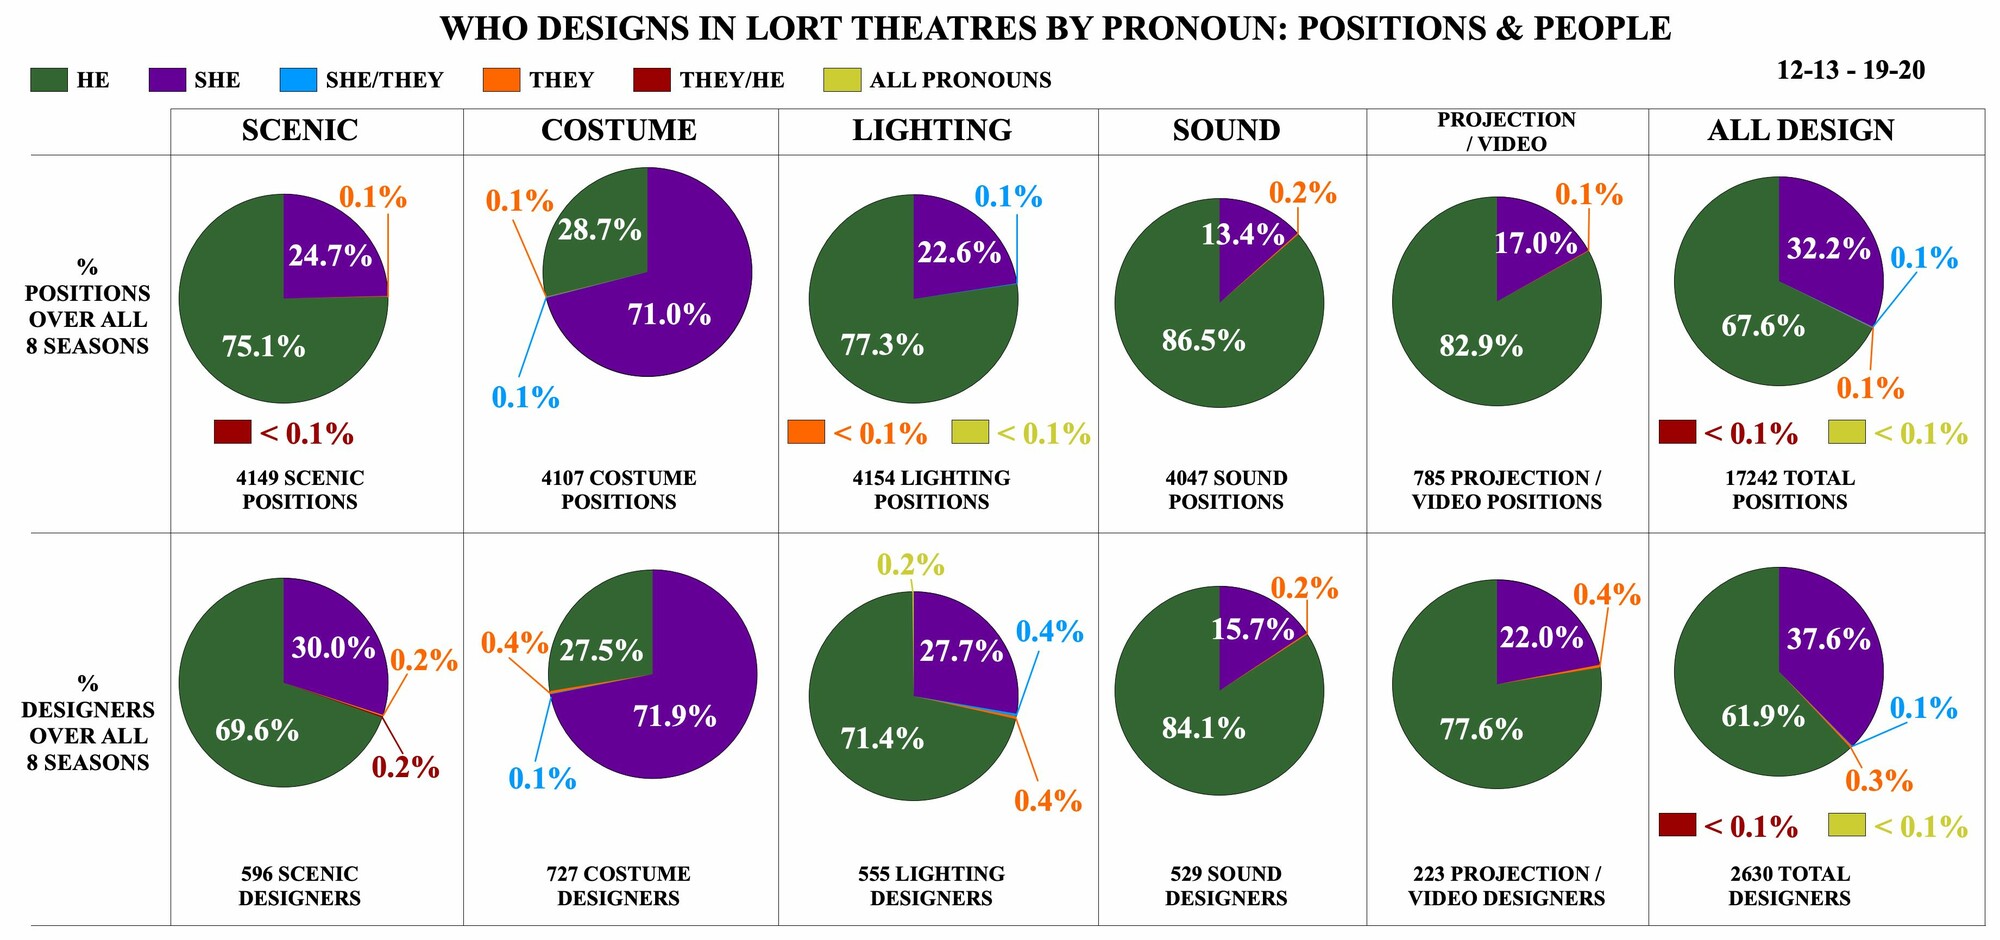
Who Designs in LORT Theatres by Pronoun: Positions and People

""

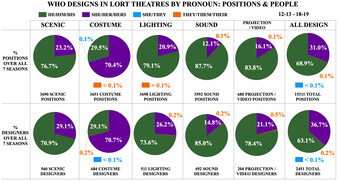
Of the 4149 scenic design positions available during the eight seasons studied, 75.1 percent were filled by designers who use “he” pronouns, 24.7 percent were filled by designers who use “she” pronouns, 0.1 percent were filled by designers who use “they” pronouns, and less than 0.1 percent were filled by designers who use “they/he” pronouns. Of the 4107 costume design positions available, 71.0 percent were filled by designers who use “she” pronouns, 28.7 percent were filled by designers who use “he” pronouns, 0.1 percent were filled by designers who use “they” pronouns, and 0.1 percent were filled by designers who use “she/they” pronouns. Of the 4154 lighting design positions available, 77.3 percent were filled by designers who use “he” pronouns, 22.6 percent were filled by designers who use “she” pronouns, and 0.1 percent were filled by designers who use “they” pronouns, less than 0.1 percent were filled by designers who use “she/they” pronouns, and less than 0.1 percent were filled by designers who use all pronouns. Of the 4047 sound design positions available, 86.5 percent were filled by designers who use “he” pronouns, 13.4 percent were filled by designers who use “she” pronouns, and 0.2 percent were filled by designers who use “they” pronouns. Of the 785 projection/video design positions available, 82.9 percent were filled by designers who use “he” pronouns, 17.0 percent were filled by designers who use “she” pronouns, and 0.1 percent were filled by designers who use “they” pronouns. Of the 17,242 design positions, 67.6 percent were filled by designers who use “he” pronouns, 32.2 percent were filled by designers who use “she” pronouns, 0.1 percent were filled by designers who use “they” pronouns, 0.1 percent were filled by designers who use “she/they” pronouns, less than 0.1 percent were filled by designers who use “they/he” pronouns, and less than 0.1 percent were filled by designers who use all pronouns.

Of the 596 scenic designers working in the eight seasons studied, 69.6 percent were designers who use “he” pronouns, 30.0 percent were designers who use “she” pronouns, 0.2 percent were designers who use “they” pronouns, and 0.2 percent were designers who use “they/he” pronouns. Of the 727 costume designers, 71.9 percent were designers who use “she” pronouns, 27.5 percent were designers who use “he” pronouns, 0.4 percent were designers who use “they” pronouns, and 0.1 percent were designers who use “she/they” pronouns. Of the 555 lighting designers, 71.4 percent were designers who use “he” pronouns, 27.7 percent were designers who use “she” pronouns, 0.4 percent were designers who use “she/they” pronouns, 0.4 percent were designers who use “they” pronouns, and 0.2 percent were designers who use all pronouns. Of the 529 sound designers, 84.1 percent were designers who use “he” pronouns, 15.7 percent were designers who use “she” pronouns, and 0.2 percent were designers who use “they” pronouns. Of the 223 projection/video designers, 77.6 percent were designers who use “he” pronouns, 22.0 percent were designers who use “she” pronouns, and 0.4 percent were designers who use “they” pronouns. Of the 2630 designers, 61.9 percent were designers who use “he” pronouns, 37.6 percent were designers who use “she” pronouns, 0.1 percent were designers who use “she/they” pronouns, 0.3 percent were designers who use “they” pronouns, less than 0.1 percent were designers who use “they/he” pronouns, and less than 0.1 percent were designers who use all pronouns.

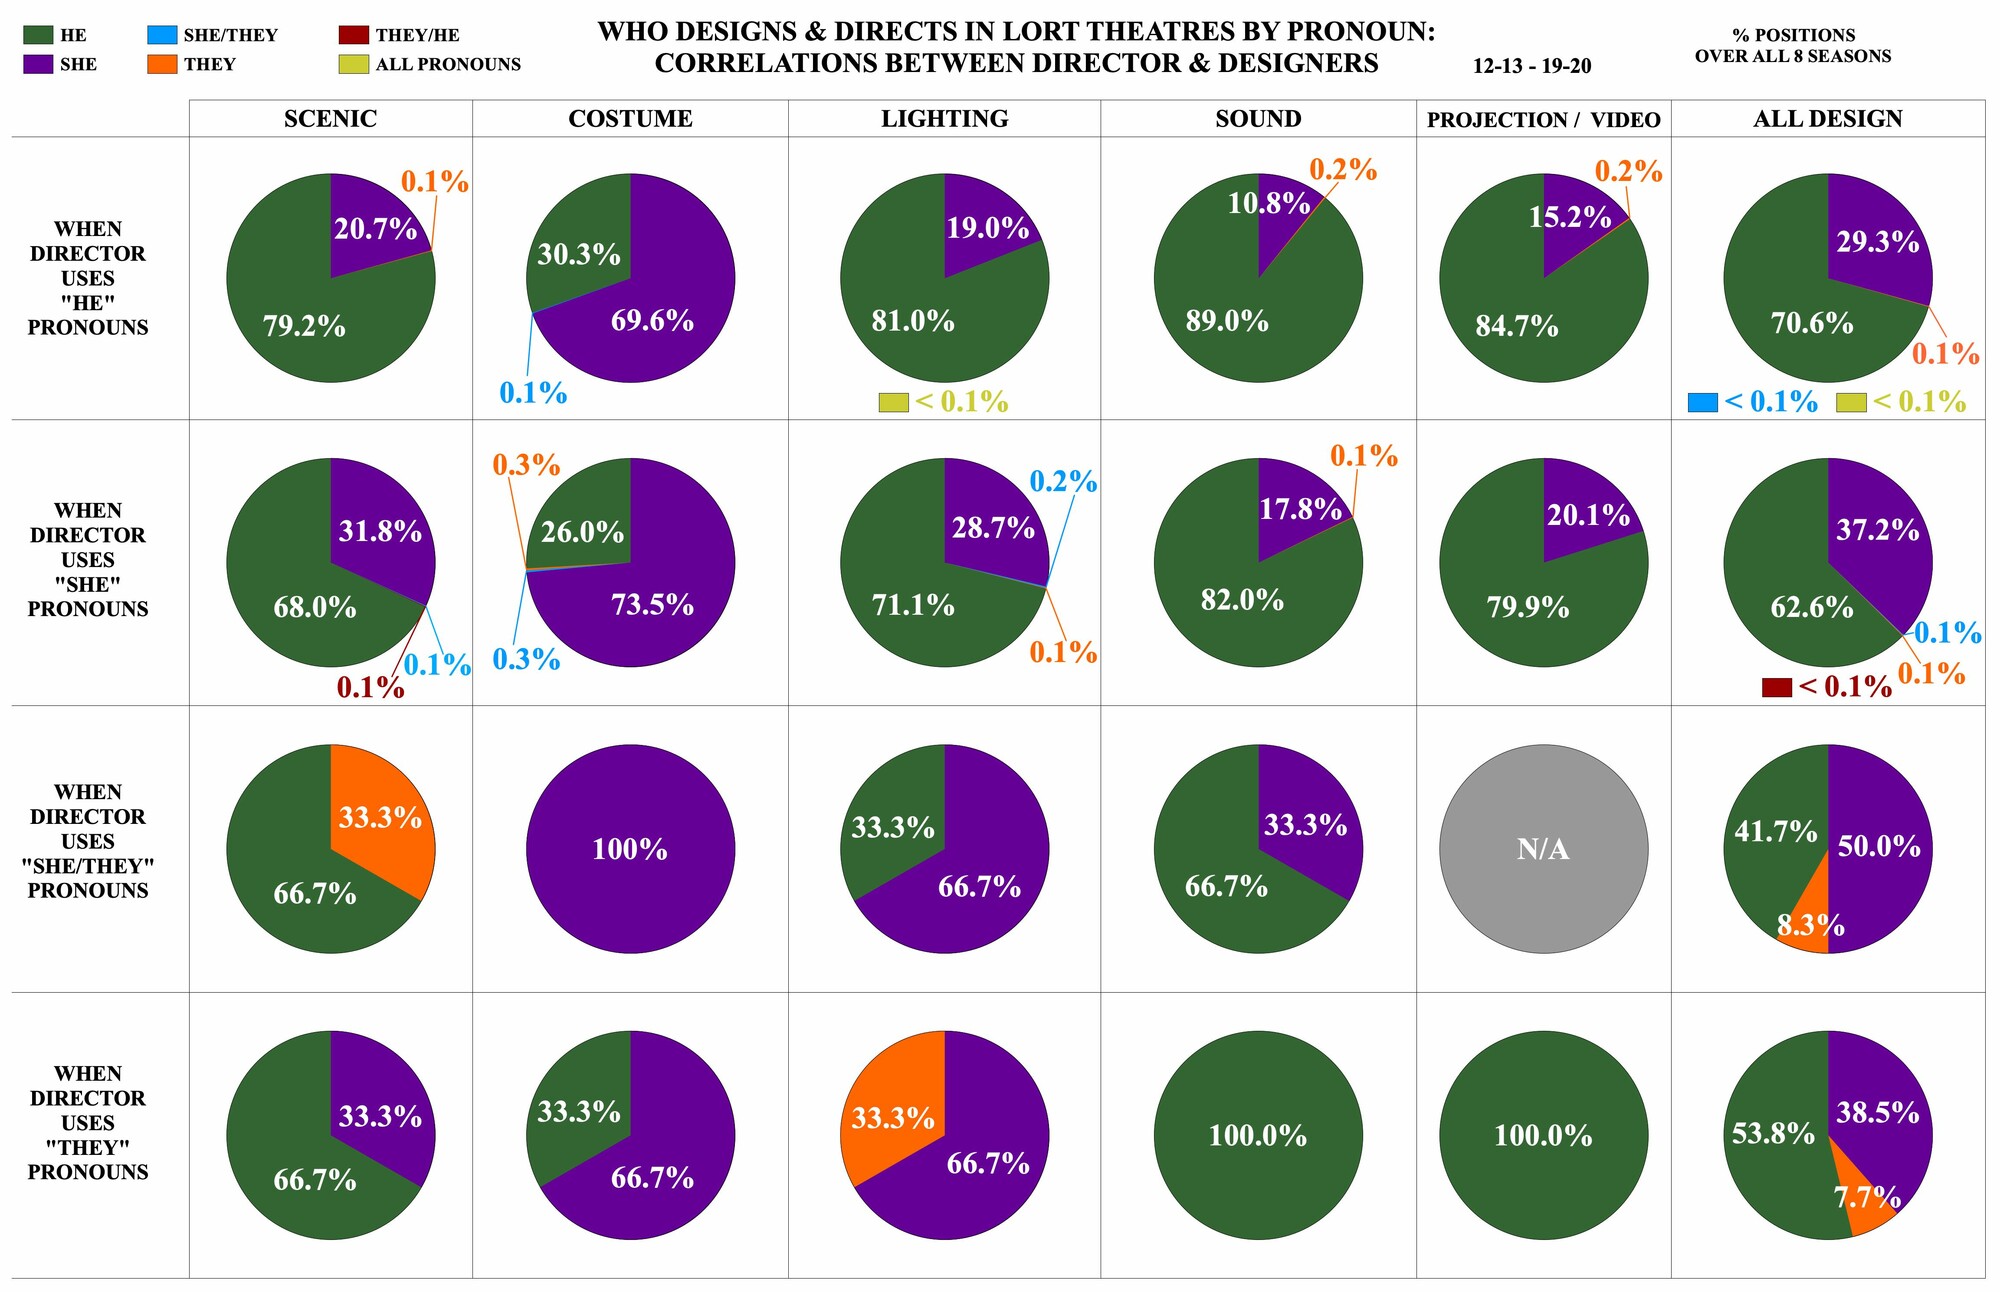
Who Designs and Directs in LORT Theatres by Pronoun: Correlations between Director and Designers

""

When the director uses “he” pronouns, 79.2 percent of the 2630 scenic design positions went to designers who use “he” pronouns, 20.7 percent to designers who use “she” pronouns, and 0.1 percent to designers who use “they” pronouns. 69.6 percent of the 2599 costume design positions went to designers who use “she” pronouns, 30.3 percent to designers who use “he” pronouns, and 0.1 percent to designers who use “she/they” pronouns. Of the 2631.5 lighting design positions, 81.0 percent went to designers who use “he” pronouns, 19.0 percent to designers who use “she” pronouns, and less than 0.1 percent to designers who use all pronouns. 89.0 percent of the 2565.5 sound design positions went to designers who use “he” pronouns, 10.8 percent to designers who use “she” pronouns, and 0.2 percent to designers who use “they” pronouns. Of the 489.33 projection/video design positions, 84.7 percent went to designers who use “he” pronouns, 15.2 percent to designers who use “she” pronouns, and 0.2 percent to designers who use “they” pronouns. 70.6 percent of all 10,915.83 design positions went to designers who use “he” pronouns, 29.3 percent to designers who use “she” pronouns, 0.1 percent to designers who use “they” pronouns, less than 0.1 percent to designers who use “she/they” pronouns, and less than 0.1 percent to designers who use all pronouns.

When the director uses “she” pronouns, 68.0 percent of the 1511 scenic design positions went to designers who use “he” pronouns, 31.8 percent to designers who use “she” pronouns, 0.1 percent to designers who use “they” pronouns, and 0.1 percent to designers who use “they/he” pronouns. Of the 1502 costume design positions, 73.5 percent went to designers who use “she” pronouns, 26.0 percent to designers who use “he” pronouns, 0.3 percent to designers who use “she/they” pronouns, and 0.3 percent to designers who use “they” pronouns. 71.1 percent of the 1513.5 lighting design positions went to designers who use “he” pronouns, 28.7 percent to designers who use “she” pronouns, 0.1 percent to designers who use “they” pronouns, and 0.2 percent to designers who use “she/they” pronouns. Of the 1473.98 sound design positions, 82.0 percent went to designers who use “he” pronouns, 17.8 percent to designers who use “she” pronouns, and 0.1 percent to designers who use “they” pronouns. 79.9 percent of the 293.66 projection/video design positions went to designers who use “he” pronouns, and 20.1 percent to designers who use “she” pronouns. Of all the 6294.14 design positions, 62.6 percent went to designers who use “he” pronouns, 37.2 percent to designers who use “she” pronouns, 0.1 percent to designers who use “she/they” pronouns, 0.1 percent to designers who use “they” pronouns, and less than 0.1 percent to designers who use “they/he” pronouns.

When the director uses “she/they” pronouns, 66.7 percent of the three scenic design positions went to designers who use “he” pronouns, and 33.3 percent to designers who use “they” pronouns. Of the three costume design positions, 100 percent went to designers who use “she” pronouns. 33.3 percent of the three lighting design positions went to designers who use “he” pronouns, and 66.7 percent to designers who use “she” pronouns. Of the three sound design positions, 66.7 percent went to designers who use “he” pronouns, and 33.3 percent to designers who use “she” pronouns. There were no projection/video design positions available. Of all the twelve design positions, 41.7 percent went to designers who use “he” pronouns, 50.0 percent to designers who use “she” pronouns, and 8.3 percent to designers who use “they” pronouns.

When the director uses “they” pronouns, 66.7 percent of the three scenic design positions went to designers who use “he” pronouns, and 33.3 percent to designers who use “she” pronouns. Of the three costume design positions, 66.7 percent went to designers who use “she” pronouns, and 33.3 percent to designers who use “he” pronouns. 66.7 percent of the three lighting design positions went to designers who use “she” pronouns, and 33.3 percent to designers who use “they” pronouns. Of the three sound design positions, 100 percent went to designers who use “he” pronouns. Of the one projection/video design position, 100 percent went to designers who use “he” pronouns. Of all the thirteen design positions, 53.8 percent went to designers who use “he” pronouns, 38.5 percent to designers who use “she” pronouns, and 7.7 percent to designers who use “they” pronouns.

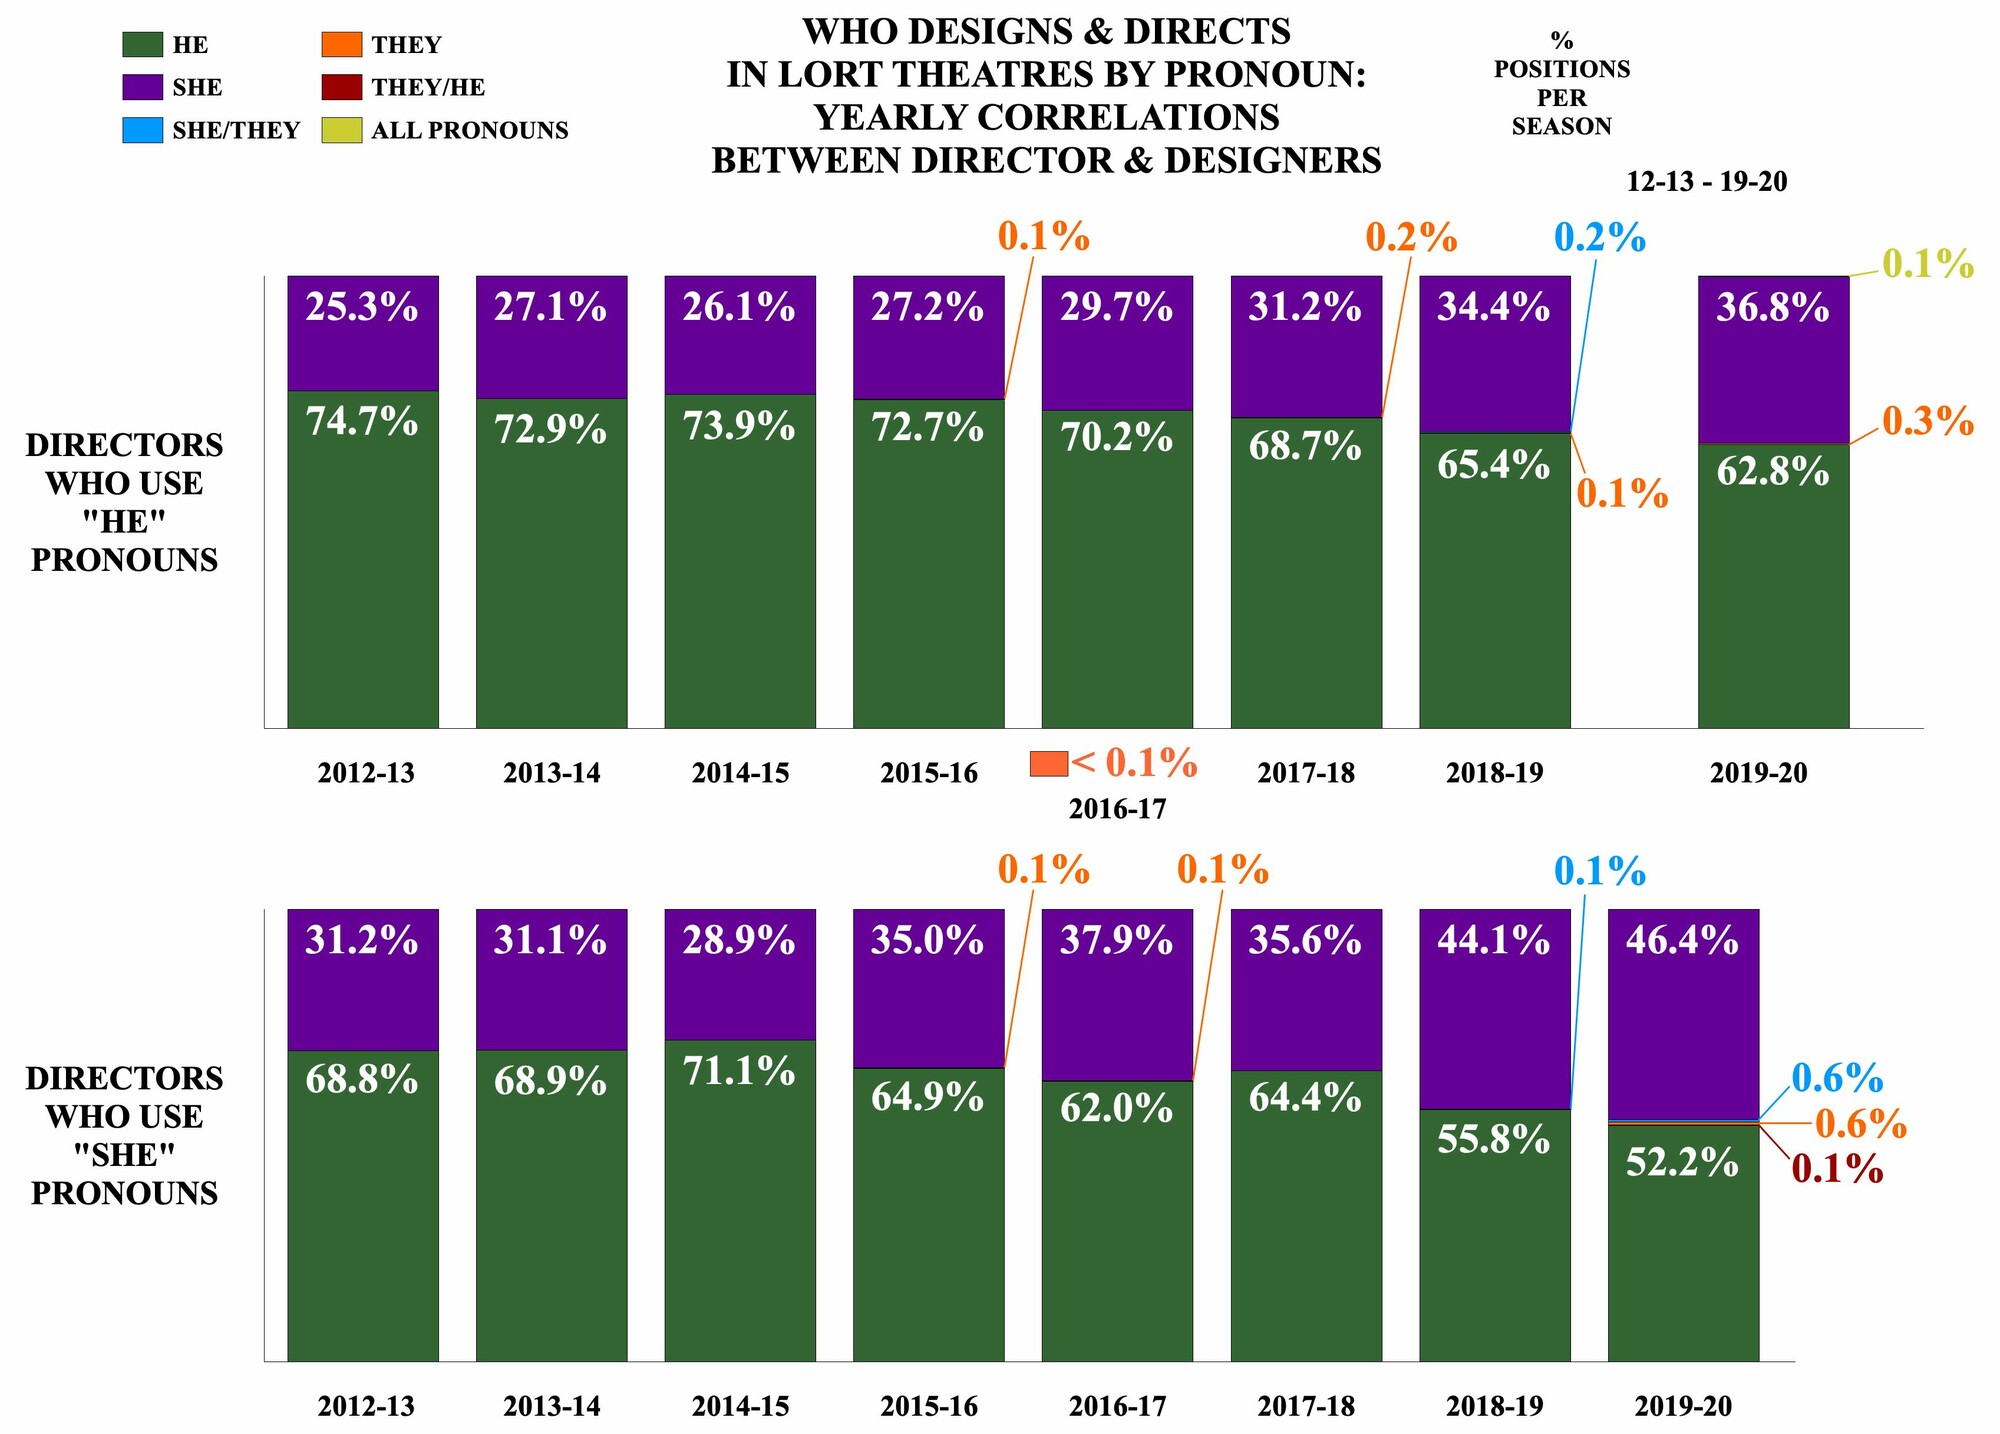
Who Designs & Directs in LORT Theatres by Pronoun: Yearly Correlations between Director & Designers

""

When the director uses “he” pronouns, from 2012-13 to 2019-20, designers who use “he” pronouns went from 74.7 percent to 72.9 percent to 73.9 percent to 72.7 percent to 70.2 percent to 68.7 percent to 65.4 percent to 62.8 percent of all design positions filled. Designers who use “she” pronouns went from 25.3 percent to 27.1 percent to 26.1 percent to 27.2 percent to 29.7 percent to 31.2 percent to 34.4 percent to 36.8 percent. From 2015-16 to 2019-20, designers who use “they” pronouns went from 0.1 percent to less than 0.1 percent to 0.2 percent to 0.1 percent to 0.3 percent of all design positions filled. Designers who use “she/they” pronouns were at 0.2 percent of all design positions filled in 2018-19. Designers who use all pronouns held 0.1 percent of all design positions filled in the 2019-20 season. Over the eight seasons studied, designers who use “he” pronouns filling positions decreased 11.9 percentage points, and designers who use “she” pronouns filling positions increased 11.5 percentage points. Over the five seasons represented, designers who use “they” pronouns increased 0.2 percentage points.

When the director uses “she” pronouns, from 2012-13 to 2019-20, designers who use “he” pronouns went from 68.8 percent to 68.9 percent to 71.1 percent to 64.9 percent to 62.0 percent to 64.4 percent to 55.8 percent to 52.2 percent of all design positions filled. Designers who use “she” pronouns went from 31.2 percent to 31.1 percent to 28.9 percent to 35.0 percent to 37.9 percent to 35.6 percent to 44.1 percent to 46.4 percent. For 2015-16 and 2016-17, designers who use “they” pronouns remained steady at 0.1 percent, and increased to 0.6 percent in 2019-20 of all design positions filled. Designers who use “she/they” pronouns were at 0.1 percent of all design positions filled in 2018-19 and increased to 0.6 percent in 2019-20. Designers who use “they/he” pronouns held 0.1 percent of all design positions filled in the 2019-20 season. Over the eight seasons studied, designers who use “he” pronouns filling positions decreased 16.6 percentage points, and designers who use “she” pronouns filling positions increased 15.2 percentage points. Over the three seasons represented, designers who use “they” pronouns increased 0.5 percentage points. Over the two seasons represented, designers who use “she/they” pronouns increased 0.5 percentage points.

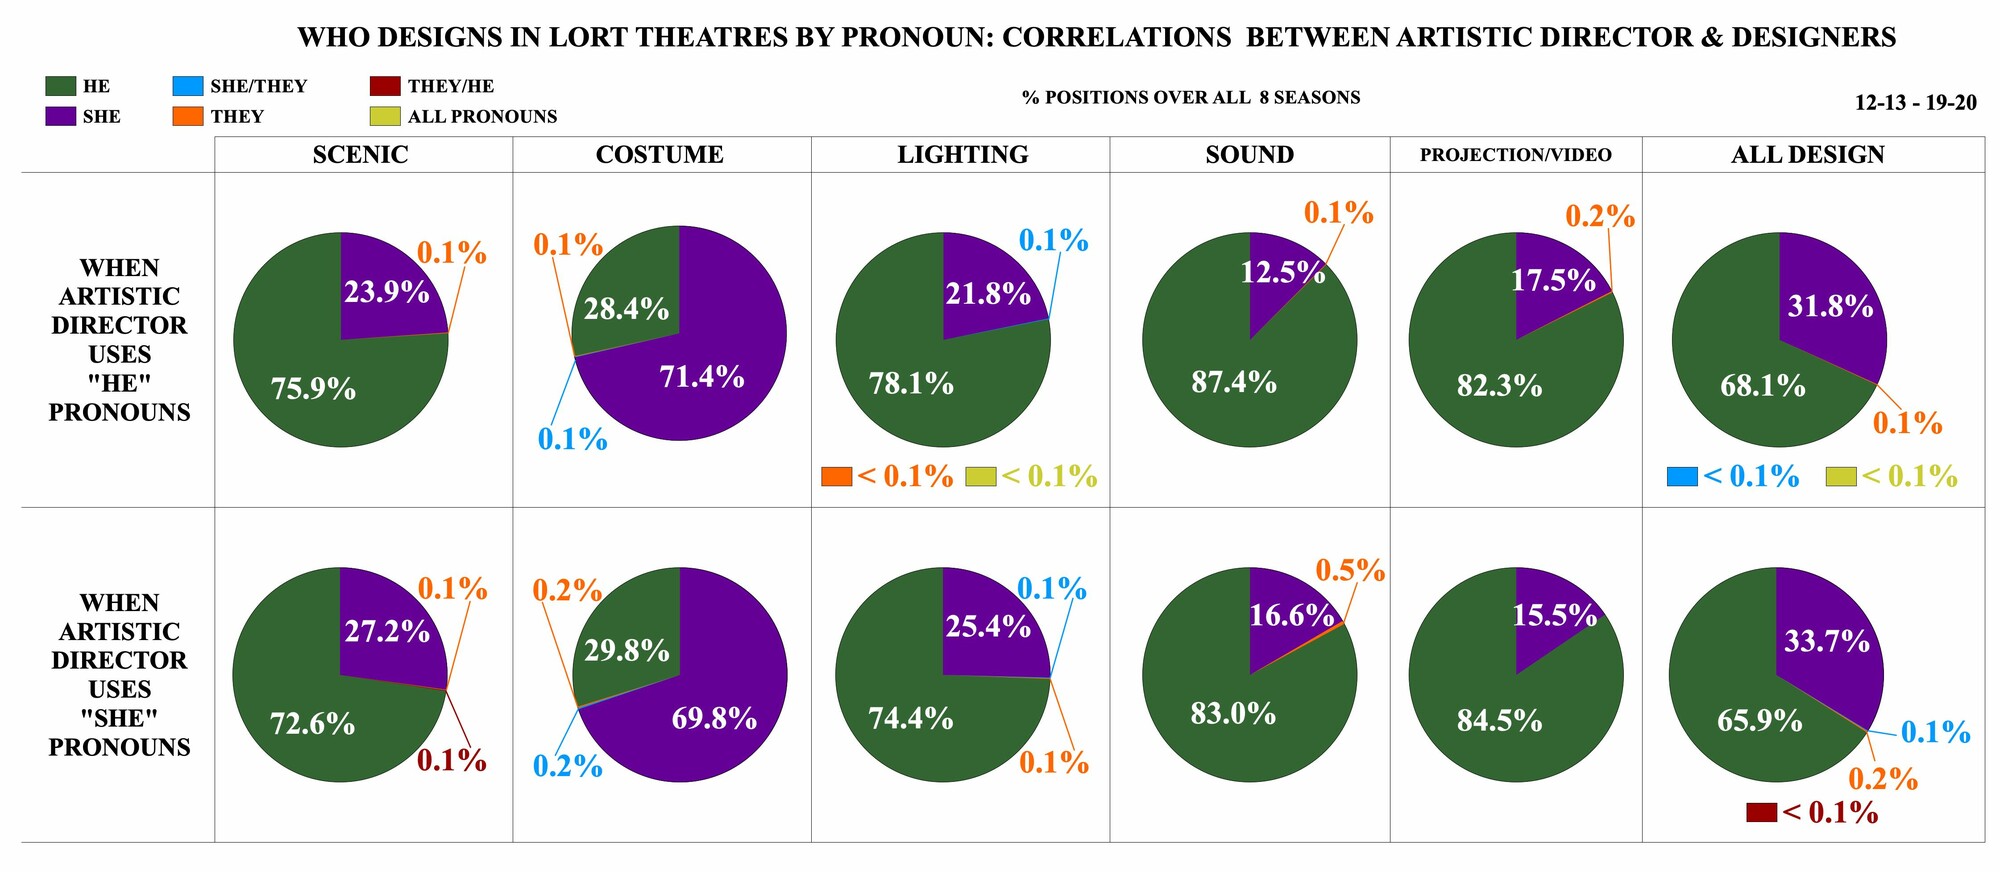
Who Designs in LORT Theatres by Pronoun: Correlations between Artistic Director and Designers

""

When the artistic director uses “he” pronouns, 75.9 percent of the 3240 scenic design positions went to designers who use “he” pronouns, 23.9 percent to designers who use “she” pronouns, and 0.1 percent to designers who use “they” pronouns. 71.4 percent of the 3207 costume design positions went to designers who use “she” pronouns, 28.4 percent to designers who use “he” pronouns, 0.1 percent to designers who use “she/they” pronouns, 0.1 percent to designers who use “they” pronouns. Of the 3242 lighting design positions, 78.1 percent went to designers who use “he” pronouns, 21.8 percent to designers who use “she” pronouns, 0.1 percent to designers who use “she/they” pronouns, less than 0.1 percent to designers who use “they” pronouns, and less than 0.1 percent to designers who use all pronouns. 87.4 percent of the 3166 sound design positions went to designers who use “he” pronouns, 12.5 percent to designers who use “she” pronouns, and 0.1 percent to designers who use “they” pronouns. Of the 582 projection/video design positions, 82.3 percent went to designers who use “he” pronouns, 17.5 percent went to designers who use “she” pronouns, and 0.2 percent to designers who use “they” pronouns. 68.1 percent of all 13,437 design positions went to designers who use “he” pronouns, 31.8 percent to designers who use “she” pronouns, less than 0.1 percent to designers who use “she/they” pronouns, 0.1 percent to designers who use “they” pronouns, and less than 0.1 percent to designers who use all pronouns.

When the artistic director uses “she” pronouns, 72.6 percent of the 904 scenic design positions went to designers who use “he” pronouns, 27.2 percent to designers who use “she” pronouns, 0.1 percent to designers who use “they” pronouns, and 0.1 percent to designers who use “they/he” pronouns. Of the 895 costume design positions, 69.8 percent went to designers who use “she” pronouns, 29.8 percent to designers who use “he” pronouns, 0.2 percent to designers who use “she/they” pronouns, and 0.2 percent to designers who use “they” pronouns. 74.4 percent of the 907 lighting design positions went to designers who use “he” pronouns, 25.4 percent to designers who use “she” pronouns, 0.1 percent to designers who use “she/they” pronouns, and 0.1 percent to designers who use “they” pronouns. Of the 876 sound design positions, 83.0 percent went to designers who use “he” pronouns, 16.6 percent to designers who use “she” pronouns, and 0.5 percent to designers who use “they” pronouns. 84.5 percent of the 203 projection/video design positions went to designers who use “he” pronouns, and 15.5 percent to designers who use “she” pronouns. Of all the 3785 design positions, 65.9 percent went to designers who use “he” pronouns, 33.7 percent to designers who use “she” pronouns, 0.1 percent to designers who use “she/they” pronouns, 0.2 percent to designers who use “they” pronouns, and less than 0.1 percent to designers who use “they/he” pronouns.

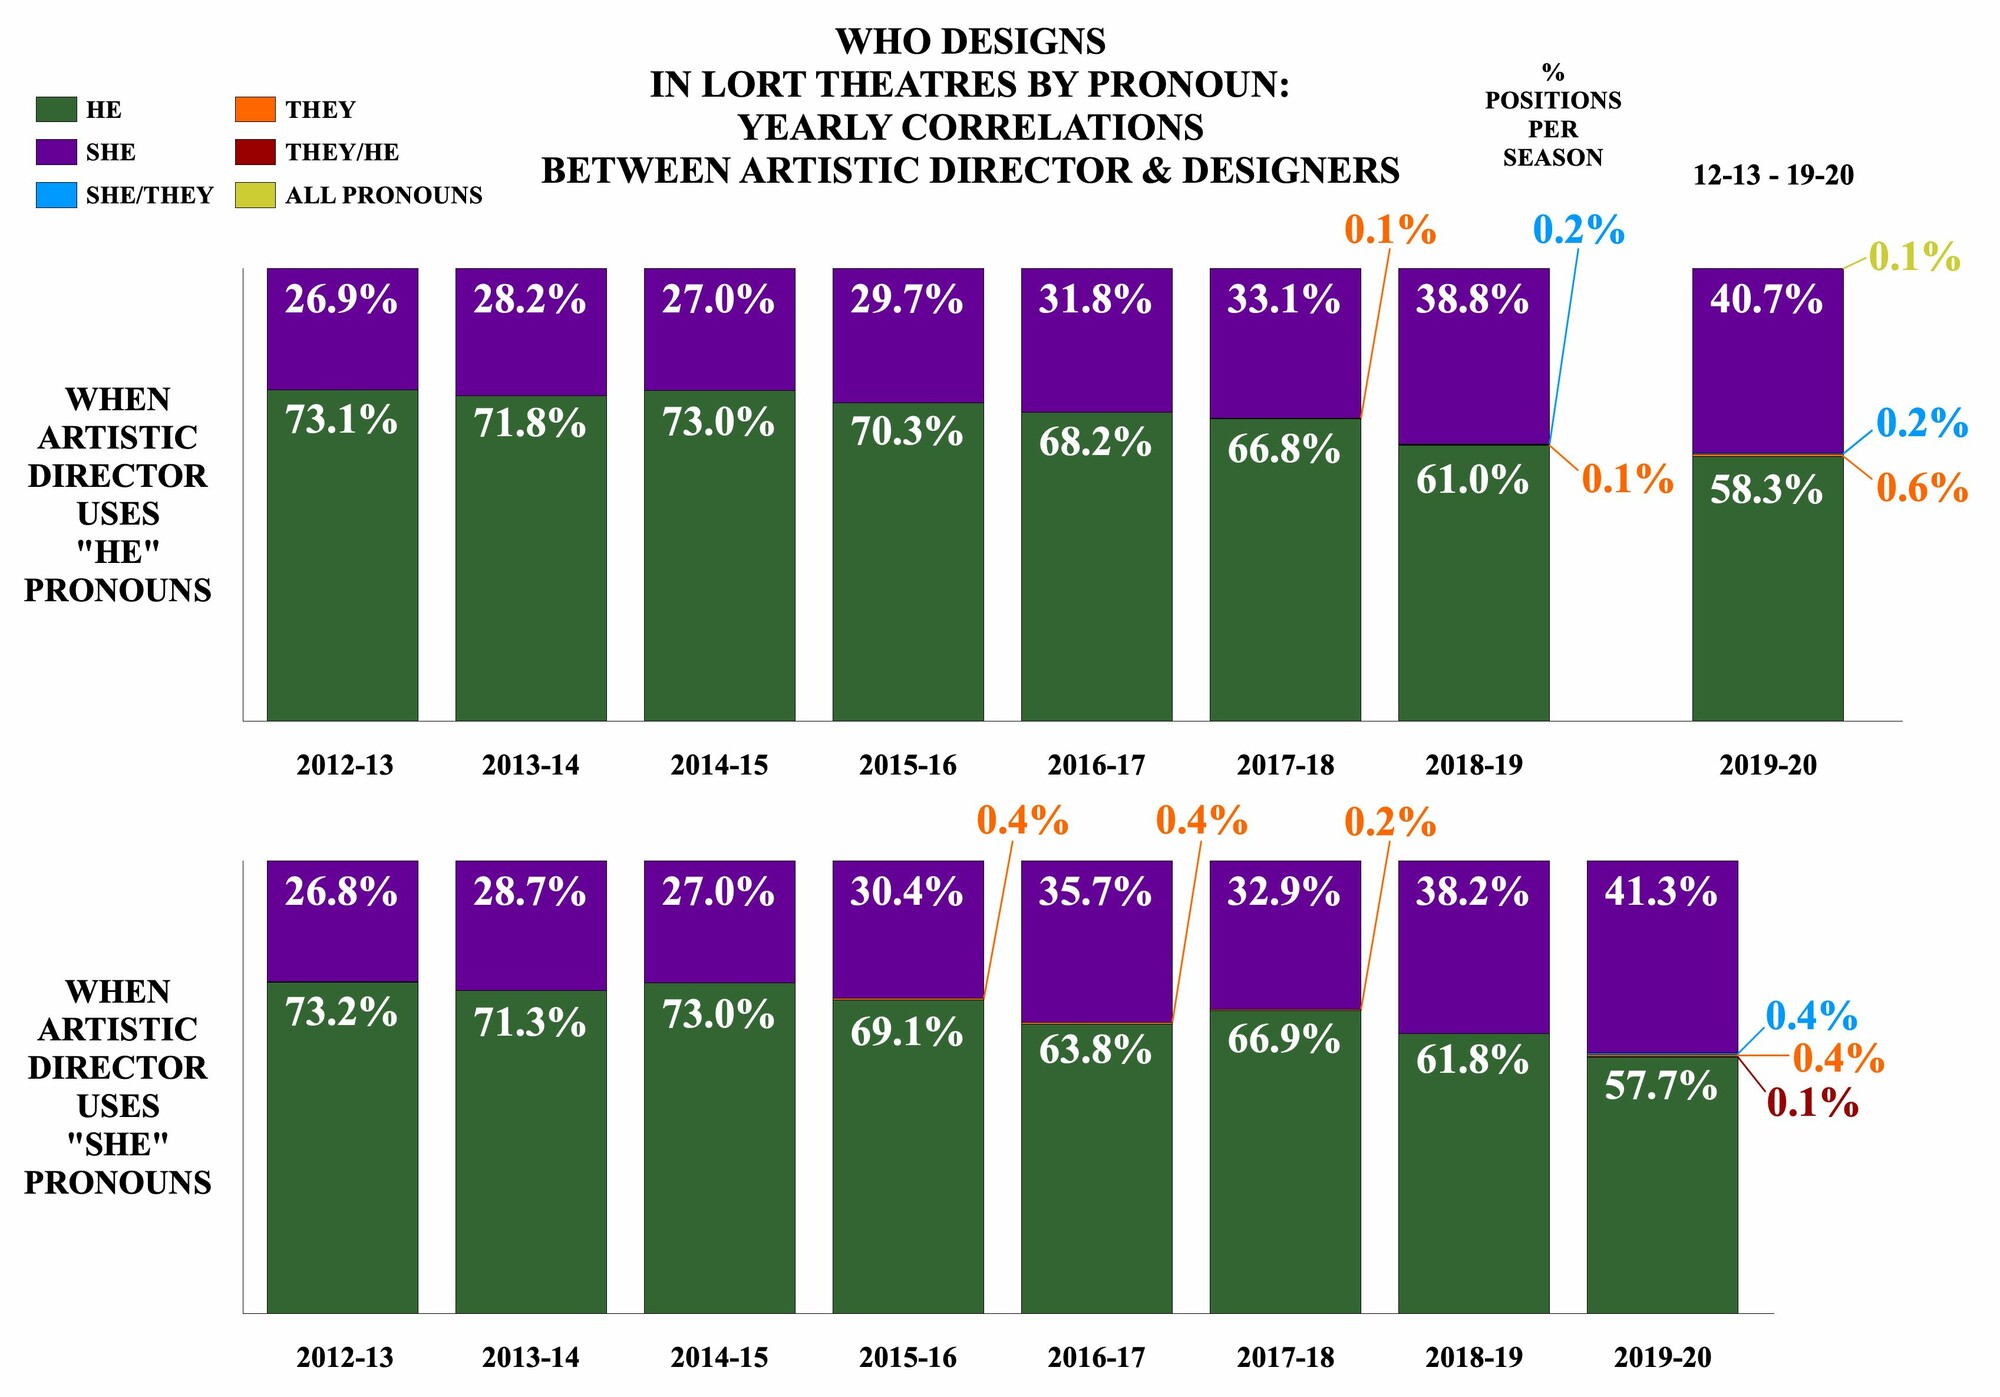
Who Designs in LORT Theatres by Pronoun: Yearly Correlations between Artistic Director & Designers

""

When the artistic director uses “he” pronouns, from 2012-13 to 2019-20, designers who use “he” pronouns went from 73.1 percent to 71.8 percent to 73.0 percent to 70.3 percent to 68.2 percent to 66.8 percent to 61.0 percent to 58.3 percent of all design positions filled. Designers who use “she” pronouns went from 26.9 percent to 28.2 percent to 27.0 percent to 29.7 percent to 31.8 percent to 33.1 percent to 38.8 percent to 40.7 percent. From 2017-18 to 2019-20, designers who use “they” pronouns went from 0.1 percent to 0.1 percent to 0.6 percent of all design positions filled. From 2018-19 to 2019-20, designers who use “she/they” pronouns went from 0.2 percent to 0.2 percent of all design positions filled. Designers who use all pronouns held 0.1 percent of all design positions filled in the 2019-20 season. Over the eight seasons studied, designers who use “he” pronouns filling positions decreased 14.8 percentage points, and designers who use “she” pronouns filling positions increased 13.8 percentage points. Over the three seasons represented, designers who use “they” pronouns increased 0.5 percentage points.

When the artistic director uses “she” pronouns, from 2012-13 to 2019-20, designers who use “he” pronouns went from 73.2 percent to 71.3 percent to 73.0 percent to 69.1 percent to 63.8 percent to 66.9 percent to 61.8 percent to 57.7 percent of all design positions filled. Designers who use “she” pronouns went from 26.8 percent to 28.7 percent to 27.0 percent to 30.4 percent to 35.7 percent to 32.9 percent to 38.2 percent to 41.3 percent. From 2015-16 to 2017-18, designers who use “they” pronouns went from 0.4 percent to 0.4 percent to 0.2 percent of all design positions filled, and in 2019-20, designers who use “they” pronouns filled 0.4 percent of all design positions filled. Designers who use “she/they” pronouns were at 0.4 percent of all design positions filled in 2019-20. Designers who use “they/he” pronouns held 0.1 percent of all design positions filled in the 2019-20 season. Over the eight seasons studied, designers who use “he” pronouns filling positions decreased 15.5 percentage points, and designers who use “she” pronouns filling positions increased 14.5 percentage points. Over the four seasons represented, designers who use “they” pronouns remained steady at 0.4 percentage points of design positions filled each season.

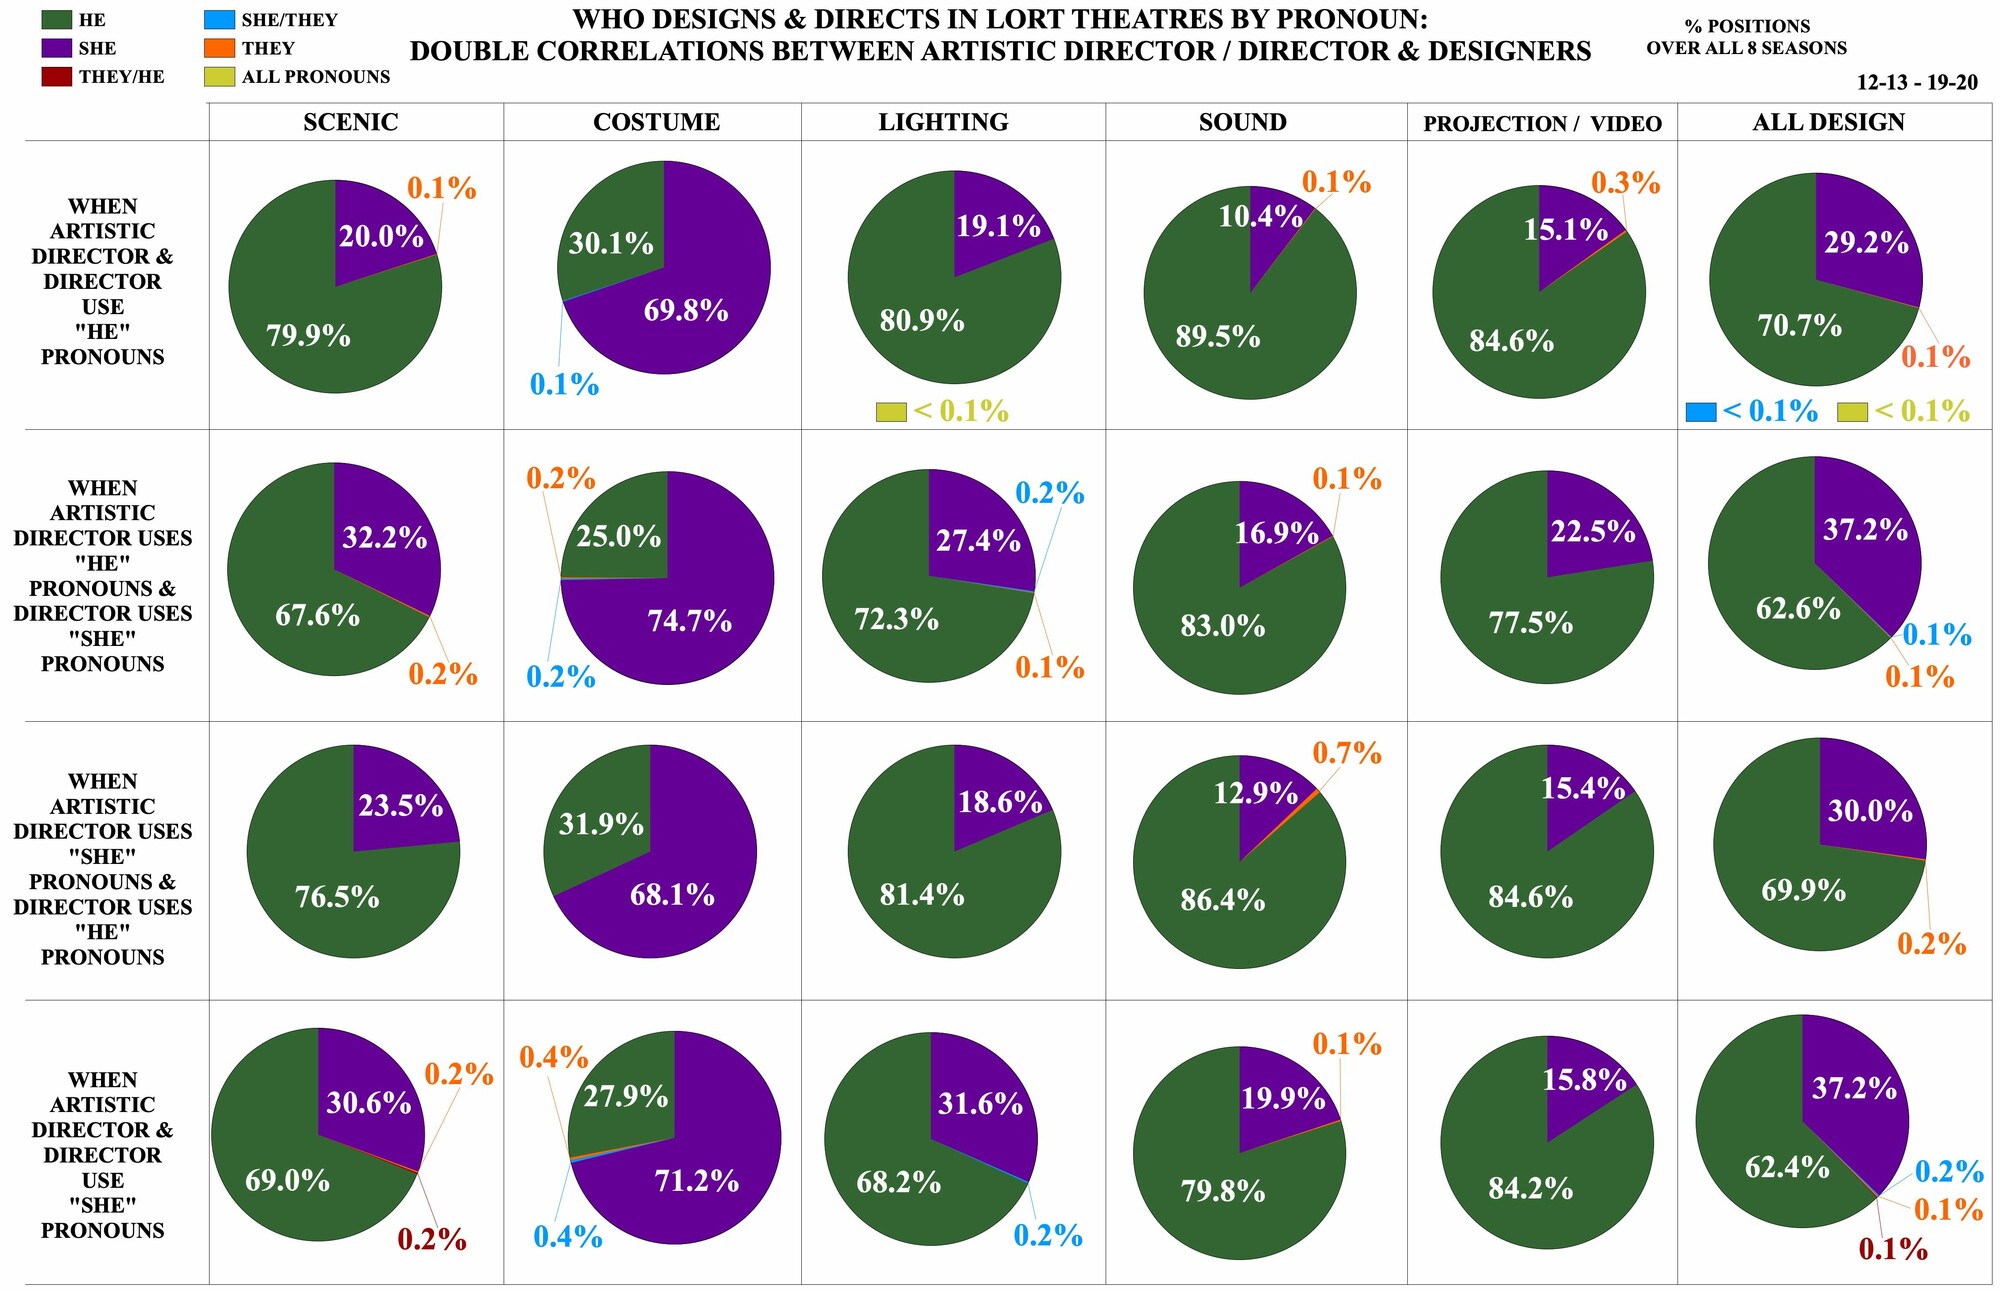
Who Designs and Directs in LORT Theatres by Pronoun: Double Correlations between Artistic Director / Director and Designers

""

When both the artistic director and the director use “he” pronouns, 79.9 percent of the 2191 scenic design positions went to designers who use “he” pronouns, 20.0 percent to designers who use “she” pronouns, and 0.1 percent to designers who use “they” pronouns. 69.8 percent of the 2166.5 costume design positions went to designers who use “she” pronouns, 30.1 percent to designers who use “he” pronouns, and 0.1 percent to designers who use “she/they” pronouns. Of the 2191 lighting design positions, 80.9 percent went to designers who use “he” pronouns, 19.1 percent to designers who use “she” pronouns, and less than 0.1 percent to designers who use all pronouns. 89.5 percent of the 2144.5 sound design positions went to designers who use “he” pronouns, 10.4 percent to designers who use “she” pronouns, and 0.1 percent designers who use “they” pronouns. Of the 393 projection/video design positions, 84.6 percent went to designers who use “he” pronouns, 15.1 percent to designers who use “she” pronouns, and 0.3 percent to designers who use “they” pronouns. 70.7 percent of all 9086 design positions went to designers who use “he” pronouns, 29.2 percent to designers who use “she” pronouns, 0.1 percent to designers who use “they” pronouns, less than 0.1 percent to designers who use “she/they” pronouns, and less than 0.1 percent to designers who use all pronouns.

When the artistic director uses “he” pronouns and the director uses “she” pronouns, 67.6 percent of the 1047 scenic design positions went to designers who use “he” pronouns, 32.2 percent to designers who use “she” pronouns, and 0.2 percent to designers who use “they” pronouns. Of the 1039.5 costume design positions, 74.7 percent went to designers who use “she” pronouns, 25.0 percent to designers who use “he” pronouns, 0.2 percent to designers who use “she/they” pronouns, and 0.2 percent to designers who use “they” pronouns. 72.3 percent of the 1048 lighting design positions went to designers who use “he” pronouns, 27.4 percent to designers who use “she” pronouns, 0.2 percent to designers who use “she/they” pronouns, and 0.1 percent to designers who use “they” pronouns. Of the 1019.5 sound design positions, 83.0 percent went to designers who use “he” pronouns, 16.9 percent to designers who use “she” pronouns, and 0.1 percent to designers who use “they” pronouns. 77.5 percent of the 189 projection/video design positions went to designers who use “he” pronouns, and 22.5 percent to designers who use “she” pronouns. Of all the 4343 design positions, 62.6 percent went to designers who use “he” pronouns, 37.2 percent to designers who use “she” pronouns, 0.1 percent to designers who use “she/they” pronouns, and 0.1 percent to designers who use “they” pronouns.

When the artistic director uses “she” pronouns and the director uses “he” pronouns, 76.5 percent of the 434 scenic design positions went to designers who use “he” pronouns, and 23.5 percent to designers who use “she” pronouns. Of the 427.5 costume design positions, 68.1 percent went to designers who use “he” pronouns, and 31.9 percent to designers who use “she” pronouns. 81.4 percent of the 435.5 lighting design positions went to designers who use “he” pronouns, and 18.6 percent to designers who use “she” pronouns. Of the 416 sound design positions, 86.4 percent went to designers who use “he” pronouns, 12.9 percent to designers who use “she” pronouns, and 0.7 percent to designers who use “they” pronouns. 84.6 percent of the 97.5 projection/video design positions went to designers who use “he” pronouns, and 15.4 percent to designers who use “she” pronouns. Of all the 1810.5 design positions, 69.9 percent went to designers who use “he” pronouns, 30.0 percent to designers who use “she” pronouns, and 0.2 percent to designers who use “they” pronouns.

When both the artistic director and director use “she” pronouns, 69.0 percent of the 467 scenic design positions went to designers who use “he” pronouns, 30.6 percent to designers who use “she” pronouns, 0.2 percent to designers who use “they” pronouns, and 0.2 percent to designers who use “they/he” pronouns. Of the 465.5 costume design positions, 71.2 percent went to designers who use “she” pronouns, 27.9 percent to designers who use “he” pronouns, 0.4 percent to designers who use “she/they” pronouns, and 0.4 percent to designers who use “they” pronouns. 68.2 percent of the 468.5 lighting design positions went to designers who use “he” pronouns, 31.6 percent to designers who use “she” pronouns, and 0.2 percent to designers who use “she/they” pronouns. Of the 457 sound design positions, 79.8 percent went to designers who use “he” pronouns, 19.9 percent to designers who use “she” pronouns, and 0.1 percent to designers who use “they” pronouns. 84.2 percent of the 104.5 projection/video design positions went to designers who use “he” pronouns, and 15.8 percent to designers who use “she” pronouns. Of all the 1962.5 design positions, 62.4 percent went to designers who use “he” pronouns, 37.2 percent to designers who use “she” pronouns, 0.2 percent to designers who use “she/they” pronouns, 0.1 percent to designers who use “they” pronouns, and 0.1 percent to designers who use “they/he” pronouns.

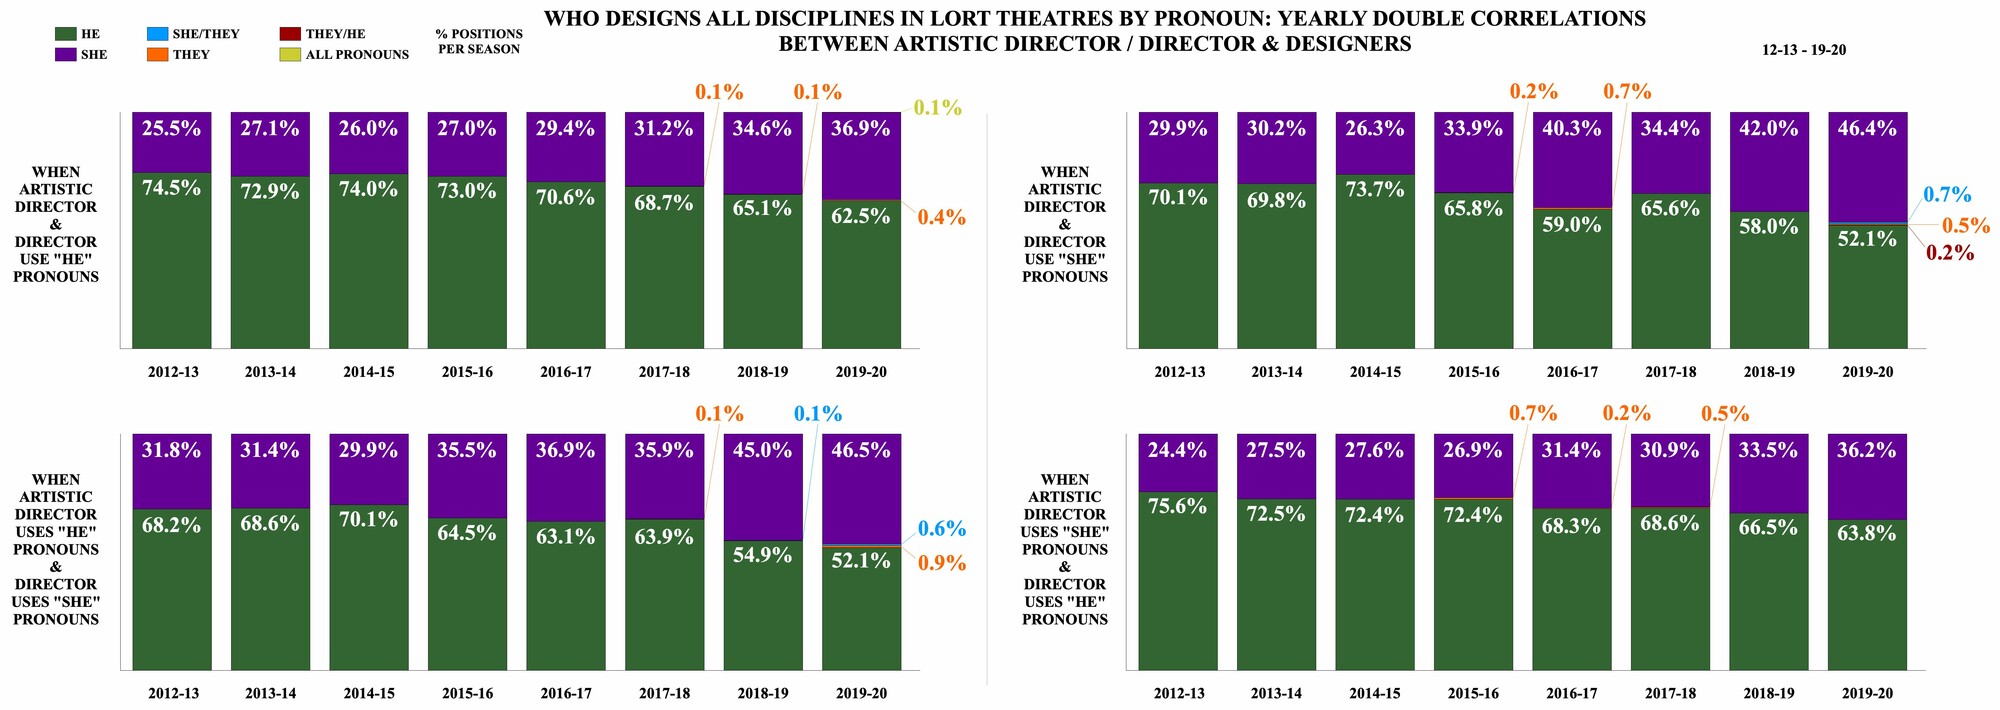
Who Designs All Disciplines in LORT Theatres by Pronoun: Yearly Double Correlations between Artistic Director / Director & Designers

""

When both the artistic director and the director use “he” pronouns, from 2012-13 to 2019-20, designers who use “he” pronouns went from 74.5 percent to 72.9 percent to 74.0 percent to 73.0 percent to 70.6 percent to 68.7 percent to 65.1 percent to 62.5 percent of all design positions filled. Designers who use “she” pronouns went from 25.5 percent to 27.1 percent to 26.0 percent to 27.0 percent to 29.4 percent to 31.2 percent to 34.6 percent to 36.9 percent. From the 2017-18 season to the 2019-20 season, designers who use “they” pronouns went from filling 0.1 percent to 0.1 percent to 0.4 percent of all design positions filled. Designers who use all pronouns filled 0.1 percent of all design positions filled in the 2019-20 season. Over the eight seasons studied, designers who use “he” pronouns filling design positions decreased 12.0 percentage points, and designers who use “she” pronouns filling design positions increased 11.4 percentage points. Over the three seasons represented, designers who use “they” pronouns increased 0.3 percentage points.

When the artistic director uses “he” pronouns and the director uses “she” pronouns, from 2012-13 to 2019-20, designers who use “he” pronouns went from 68.2 percent to 68.6 percent to 70.1 percent to 64.5 percent to 63.1 percent to 63.9 percent to 54.9 percent to 52.1 percent of all design positions filled. Designers who use “she” pronouns went from 31.8 percent to 31.4 percent to 29.9 percent to 35.5 percent to 36.9 percent to 35.9 percent to 45.0 percent to 46.5 percent of all design positions filled each season. Designers who use “they” pronouns filled 0.1 percent of all design positions in the 2017-18 season, and 0.9 percent of all design positions filled in the 2019-20 season. From the 2018-19 season to the 2019-20 season, designers who use “she/they” pronouns went from filling 0.1 percent to 0.6 percent of all design positions filled. Over the eight seasons studied, designers who use “he” pronouns filling design positions decreased 16.1 percentage points, and designers who use “she” pronouns filling design positions increased 14.7 percentage points. Over the two seasons represented, designers who use “she/they” pronouns increased 0.5 percentage points. Over the two seasons represented, designers who use “they” pronouns increased 0.8 percentage points.

When the artistic director uses “she” pronouns and the director uses “he” pronouns, from 2012-13 to 2019-20, designers who use “he” pronouns went from 75.6 percent to 72.5 percent to 72.4 percent to 72.4 percent to 68.3 percent to 68.6 percent to 66.5 percent to 63.8 percent of all design positions filled. Designers who use “she” pronouns went from 24.4 percent to 27.5 percent to 27.6 percent to 26.9 percent to 31.4 percent to 30.9 percent to 33.5 percent to 36.2 percent of all design positions filled. From 2015-16 to 2017-18, designers who use “they” pronouns went from 0.7 percent to 0.2 percent to 0.5 percent of all the design positions each season. Over the eight seasons studied, designers who use “he” pronouns filling design positions decreased 11.8 percentage points, and designers who use “she” pronouns filling design positions increased 11.8 percentage points. Over the three seasons represented, designers who use “they” pronouns filling design positions decreased 0.2 percent points.

When both the artistic director and director use “she” pronouns, from 2012-13 to 2019-20, designers who use “he” pronouns who use “he” pronouns went from 70.1 percent to 69.8 percent to 73.7 percent to 65.8 percent to 59.0 percent to 65.6 percent to 58.0 percent to 52.1 percent of all design positions filled. Designers who use “she” pronouns went from 29.9 percent to 30.2 percent to 26.3 percent to 33.9 percent to 40.3 percent to 34.4 percent to 42.0 percent to 46.4 percent of all design positions filled. Designers who use “they” pronouns went from filling 0.2 percent to 0.7 percent of all design positions filled for the 2015-16 season to 2016-17 season, and 0.5 percent for the 2019-20 season of all the design positions filled. Designers who use “she/they” pronouns held 0.7 percent for the 2019-20 season of all the design positions filled that seasons. Designers who use “they/he” pronouns held 0.2 percent for the 2019-20 season of all the design positions filled that seasons. Over the eight seasons studied, designers who use “he” pronouns filling design positions decreased 18.0 percentage points, and designers who use “she” pronouns filling design positions increased 16.5 percentage points. Over the three seasons represented, designers who use “they” pronouns filling design positions increased 0.3 percent points.


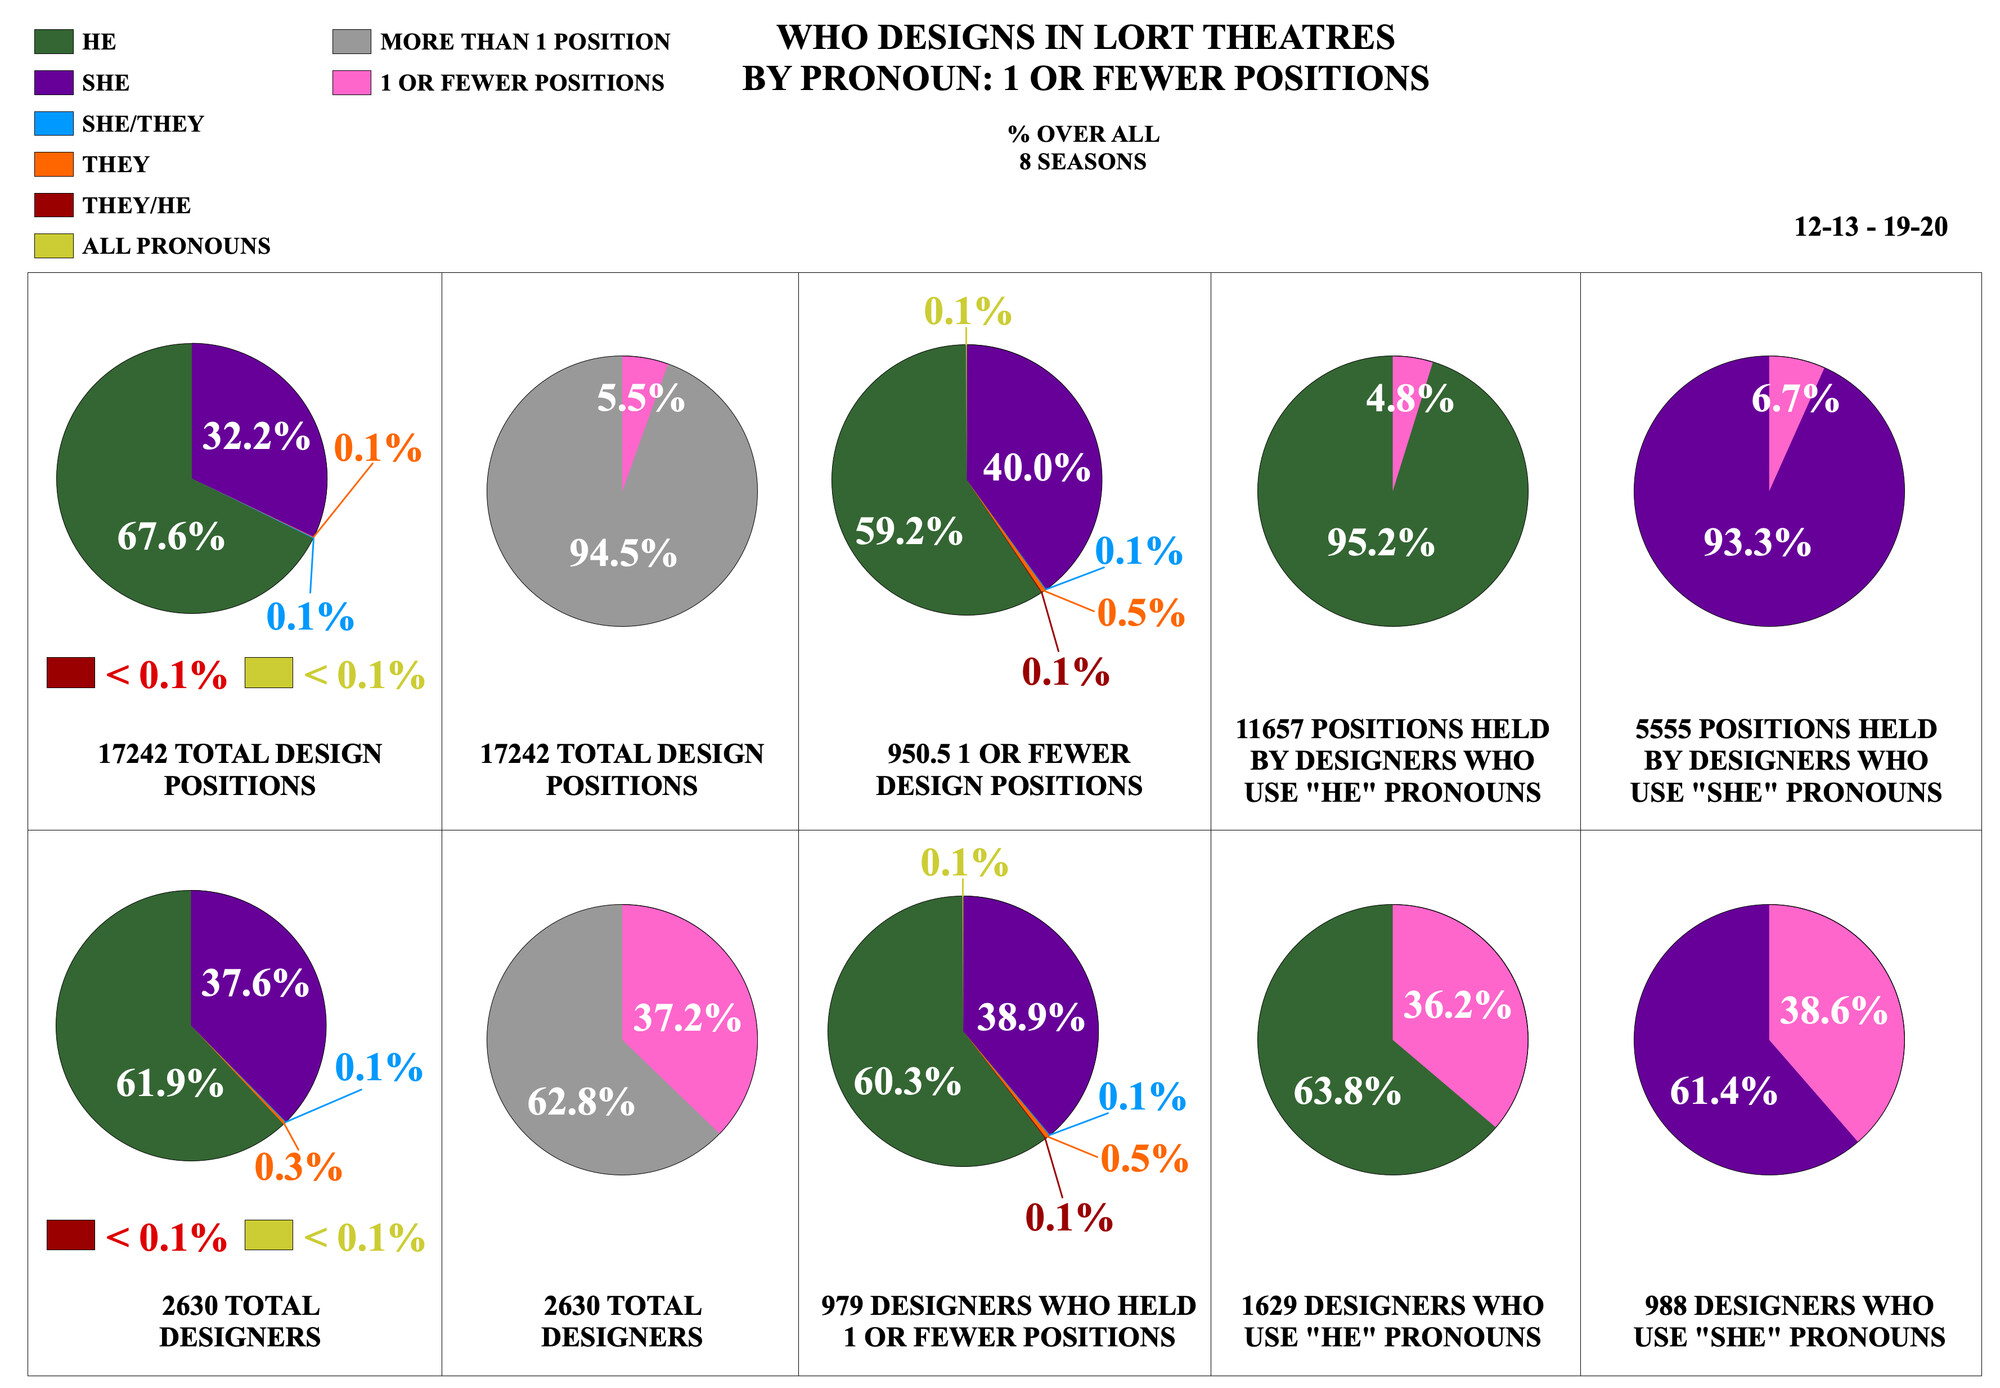
Who Designs in LORT Theatres by Pronoun: One or Fewer Positions

""

Of the 17,242 design positions, 67.6 percent were filled by designers who use “he” pronouns, 32.2 percent were filled by designers who use “she” pronouns, 0.1 percent were filled by designers who use “they” pronouns, 0.1 percent were filled by designers who use “she/they” pronouns, less than 0.1 percent were filled by designers who use “they/he” pronouns, and less than 0.1 percent were filled by designers who use all pronouns. Of the 17,242 design positions, 5.5% were held by designers who designed one or fewer productions during the eight seasons studied. Of those 950.5 positions, 59.2 percent were held by designers who use “he” pronouns, 40.0 percent by designers who use “she” pronouns, 0.1 percent by designers who use “she/they” pronouns, 0.5 percent by designers who use “they” pronouns, 0.1 percent by designers who use “they/he” pronouns, and 0.1 percent by designers who use all pronouns. Of the 11,657 design positions held by designers who use “he” pronouns, 4.8 percent were held by designers who use “he” pronouns who designed one or fewer productions during the eight seasons studied. Of the 5555 design positions held by designers who use “she” pronouns, 6.7 percent were held by designers who use “she” pronouns who designed one or fewer productions during the eight seasons studied.

Of the 2630 designers, 61.9 percent were designers who use “he” pronouns, 37.6 percent were designers who use “she” pronouns, 0.1 percent were designers who use “she/they” pronouns, 0.3 percent were designers who use “they” pronouns, less than 0.1 percent were designers who use “they/he” pronouns, and less than 0.1 percent were designers who use all pronouns. Of the 2630 designers, 37.2 percent were designers who designed one or fewer productions during the eight seasons studied. Of the 979 one or fewer positions designers. 60.3 percent were designers who use “he” pronouns, 38.9 percent were designers who use “she” pronouns, 0.1 percent were designers who use “she/they” pronouns, 0.5 percent were designers who use “they” pronouns, 0.1 percent were designers who use “they/he” pronouns, and 0.1 percent by designers who use all pronouns. Of the 1629 designers who use “he” pronouns, 36.2 percent were designers who use “he” pronouns who designed one or fewer productions during the eight seasons studied. Of the 988 designers who use “she” pronouns, 38.6 percent were designers who use “she” pronouns who designed one or fewer productions during the eight seasons studied.

Who Designs in LORT Theatres by Pronoun: “New” to LORT and All Eight Seasons

""

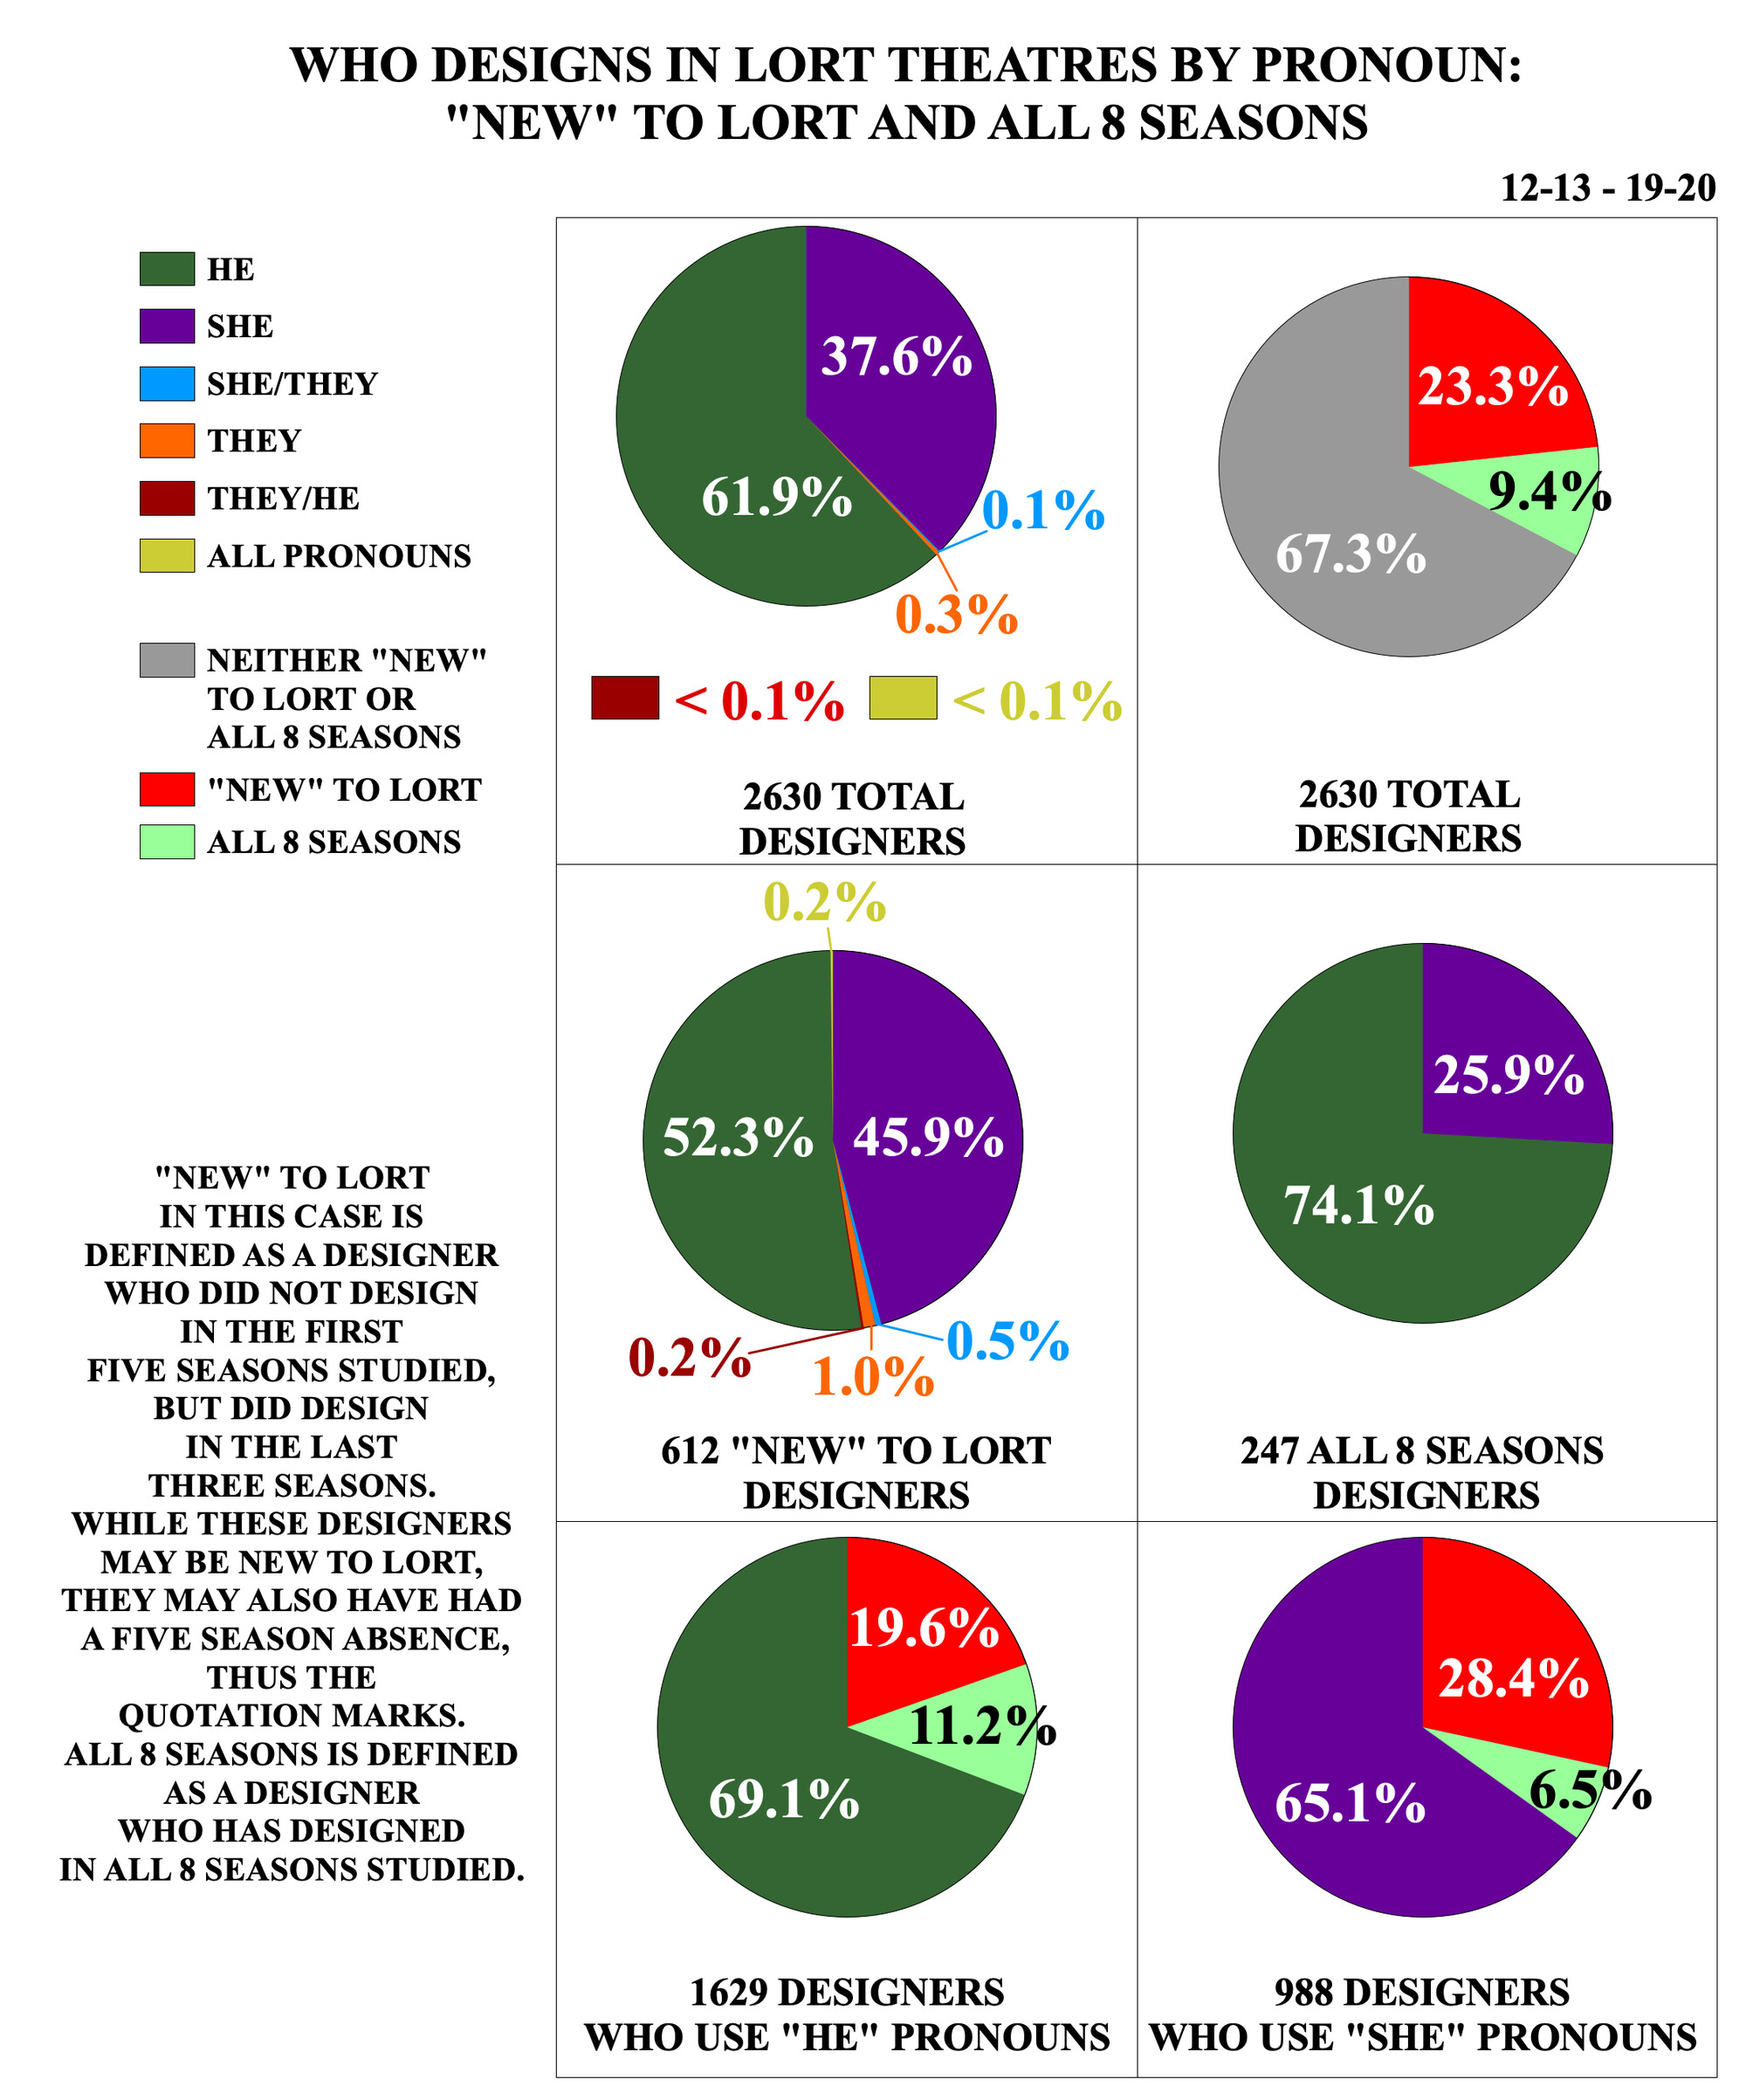
Of the 2630 total designers, 61.9 percent were designers who use “he” pronouns, 37.6 percent were designers who use “she” pronouns, 0.1 percent were designers who use “she/they” pronouns, 0.3 percent were designers who use “they” pronouns, less than 0.1 percent were designers who use “they/he” pronouns, and less than 0.1 percent were designers who use all pronouns. Of the 2630 total designers, 612 designers or 23.3% percent were designers who were “new” to LORT, meaning they did not design in the first five seasons studied but did during the last three seasons studied. Of the 2630 total designers, 247 designers or 9.4% percent were designers who designed in all eight seasons studied.

Of the 612 “new” to LORT designers, 320 designers or 52.3 percent were designers who use “he” pronouns, 281 designers or 45.9 percent were designers who use “she” pronouns, three designers or 0.5 percent were designers who use “she/they” pronouns, six designers or 1.0 percent were designers who use “they” pronouns, one designer or 0.2 percent was a designer who uses “they/he” pronouns, and one designer or 0.2 percent was a designer who uses all pronouns. Of the 257 all eight seasons designers, 183 designers or 74.1 percent were designers who use “he” pronouns and sixty-four designers or 25.9 percent were designers who use “she” pronouns.

Of the 1629 designers who use “he” pronouns, 320 designers or 19.6 percent were “new” to LORT designers who use “he” pronouns. Of the 1629 designers who use “he” pronouns, 183 designers or 11.2 percent were all eight seasons designers who use “he” pronouns. Of the 988 designers who use “she” pronouns, 281 designers or 28.4 percent were “new” to LORT designers who use “she” pronouns. Of the 988 designers who use “she” pronouns, sixty-four designers or 6.5 percent were all eight seasons designers who use “she” pronouns.
 

Bookmark this page

Log in to add a bookmark

Comments

1
Add Comment

The article is just the start of the conversation—we want to know what you think about this subject, too! HowlRound is a space for knowledge-sharing, and we welcome spirited, thoughtful, and on-topic dialogue. Find our full comments policy here

Newest First

Thank you to all my Patreon subscribers over the years:

Dahlia A., Claudia Alick, Amy Altadonna, Calvin Anderson, Lianne Arnold, Andie Arthur, Marcy Barbeau, Valerie Therese Bart, Mark Barton, Travis Bedard, Kate Bergstrom, Sarah Biz, Nicole Brewer, Lucrecia Briceno, Sara Brookner, Rachel Browne, Alexey Timbul Bulokhov, Shawna Cadence, Xandria Easterday Callahan, Russell Champa, Maria Chunn, Paula Clarkson, Katrina Coltun, Jane Cox, Miriam Crowe, Sarah Cubbage, Nadine Grant Daley, Linda Essig, Eric Farber, Rachel Fink, Matt Foss, Kate Fossner, Kate Freer, Jamie Gahlon, Ian Garrett, Rachel Grossman, Sabrina Hamilton, Elizabeth Harper, Eric Hart, Natalie Taylor Hart, Rachel Hewitt, Elsa Hiltner, Andrew Hungerford, Andrew Hunt, Adam Immerwahr, Elisheba Ittoop, Lavina Jadhwani, Mimsi Janis, Lindsay Jones, Krystal Kennel, Wu Chen Khoo, Bradley King, Sarah Krainin, Peter J. Kuo, Celeste Lagrotteria, Edmund A. LeFevre, Jr., Wen-Ling Liao, Mike Mallinson, Angela Marshall, Cary Patrick Martin, Michael Maso, Twi McCallum, Kevin McCoy, David McGraw, Jennifer McMenemy, Tyler Micoleau, Derek Miller, Winter Miller, Chris Moad, Sherrice Marie Mojgani, Melissa Moschitto, Margo Moskowitz, Martha Mountain, Carolyn Mraz, Julie Nelson, Jules Odendahl-James, Carolina Ortiz, Johanna Pan, Nicole Pearce, Kathy Perkins, Jocelyn Prince, Gina Pulice, Clint Ramos, Hannah Hessel Ratner, Jacqueline Reid, Nathan Renner-Johnson, Mindy Richardson, Michael Robertson, Natalie Robin, Kristen Robinson, Meghan Roche, Emily Rollie, John Rooney, MaeAnn Ross, Mary Sader, Adam Salberg, Barbara Samuels, Josh Samuels, Megan Sandberg-Zakian, Jennifer Schriever, Susan Shay, Eli Van Sickel, Charly Simpson, Sophia Skiles, Amy Smith, Dante Olivia Smith, Eric Southern, Amanda Spooner, M. Florian Staab, Kate Stack, Cat Tate Starmer, Mary Eleanor Stebbins, Ethan Steimel, Alice Steinke, Brad Steinmetz, Sarah Storm, Ryan Sweeney, Alice Tavener, Mei Ann Teo, National Women’s Theatre Festival, Christine Tschirgi, Tirzah Tyler, Kristen van Ginhoven, Jen Waldman, Adam Wassilchalk, Donyale Werle, Jo Winiarski, Jennifer Wishcamper, Tal Yarden, Kat Yen, Jeanette Yew, Aileen Zeigler, David Zinn, Akihiko, Deanna, ETM, JB, Linda, nopowerintheverse, TheRothwoman